Trading Update: Friday April 1, 2022
Emini pre-open market analysis
Emini daily chart
- Emini yesterday was a big bear bar with its close on low. The bear breakout bar was enough to make the odds favor a small second leg down.
- Yesterday was also a reminder that the daily chart is in a trading range. While the bulls were expecting a pullback, they did not want to see a bar that big closing on its low. It increases the odds of the market going sideways instead of much higher.
- One thing to point out is that trading ranges are notorious for making traders hopeful that the breakout will be successful and go higher.
- The rally up to March 29 was strong, and while it had some disappointment, it was overall a strong rally. This makes traders hopeful that the rally will continue after any reversal down.
- March 31 was a strong bear bar, making traders question if there are more sellers above the bar instead of buyers, which means scale in bulls may look to sell out of longs somewhere between the February 2 high and the 4,600 big round number.
- The bears are hopeful that today will be another big bear bar closing on its low, which would increase the odds of lower prices and a test back down to the middle of the February – March trading range (4,340 price level).
- More likely, today will probably have a weak bull close. This would disappoint both the bulls and the bears.
- Since the market is in a trading range, the market may have to reach the March 3 breakout point sometime in April. This is because trading ranges usually test obvious breakout points.
Emini 5-minute chart and what to expect today
- Emini is up 5 points in the overnight Globex session.
- The Globex market has been in a tight bull channel since yesterday’s U.S. session. This will increase the odds of today having a lot of trading range price action.
- Traders should pay attention to the day’s opening because if it is a trading range day, the market may test it multiple times today.
- On the open, traders should expect a limit order open and wait for a credible stop entry or strong breakout with follow-through.
- Today is Friday, so weekly support and resistance are essential. Right now, the market is not far above the open of the week (4529.5), which means it may be a magnet for the entire day, so traders need to pay attention to it.
- Also, since it is Friday, there is a greater risk of a surprise breakout up or down late in the day as the market decides on the close of the weekly chart.
Yesterday’s Emini setups
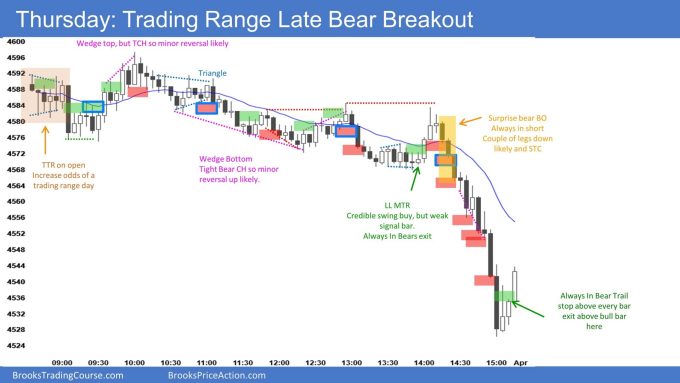
- Al Brooks on London PA Symposium and overseas break.

Emini charts created by Brad. Al will be back on April 11, 2022
EURUSD Forex market trading strategies
EURUSD Forex daily chart

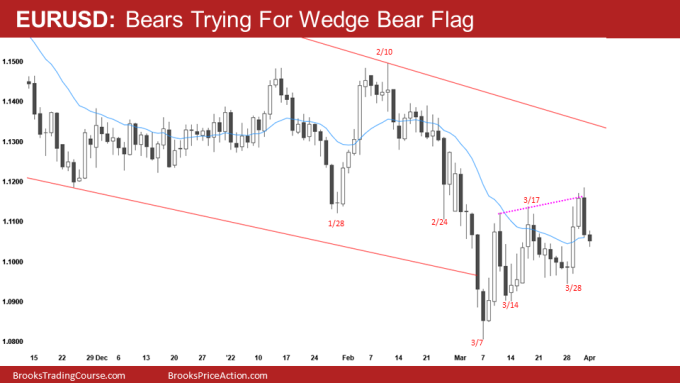
- The bears were able to disappoint the bulls and get a big bear bar closing on its low for the wedge top. This is not what the bulls want after two strong bull breakout bars.
- The bulls that bought yesterday’s close are trapped and will probably exit below yesterday’s low.
- While the market may get a second leg up from the two-bar bull breakout before it reaches the March 28 low, there is likely too much risk of a downside bear breakout for bulls to hold long below this bar.
- The bulls will likely step aside here and see how strong the bears are. This is similar to March 21, when the bulls gave the bears a chance; however, the bears were not strong enough to get a strong breakout, and the bulls bought again aggressively on March 29.
- The bulls still hope the market is in a bull channel, so some bulls will buy here, trying to create another higher low and a bull breakout of the wedge bear flag.
- The bears have a credible wedge top now, so if the bulls break above it, there is a 50% chance the bull gets a measured move up.
- Overall, selling below yesterday’s low is a low probability trade for the bears. However, yesterday was not what the bulls wanted to see and increased the odds of more sideways to down.
- Another thing to think about is that this may be the early stage of a bull trend that lasts for several months. This means that early trends typically try and trap traders out of the market to force them to chase the market up. For example: If a bull bought anywhere, they must now decide if they should get out below yesterday’s bar and risk missing an upside bull breakout.
Summary of today’s S&P Emini futures price action and what to expect tomorrow

Emini charts created by Brad. Al will be back on April 11, 2022
End of day summary
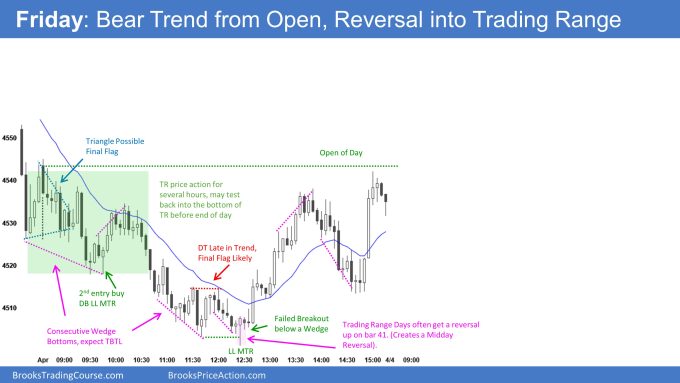
- The day opened as a trading range and went sideways, testing the moving average.
- The bears tried for a bear breakout around bar 10; however, with all the trading range price action on the open and the market getting close to the moving average but not touching it, the bears failed, and the market rallied to the moving average around bar 10.
- The market formed a wedge bottom around 10:15 (central time/8:15 PT), leading to a bear breakout below the opening range. This bear breakout leads to a couple of legs down and more sideways.
- The low of the day was around 12:30 (central/ 10:30 PT) and was a failed bear breakout of a wedge bottom that reversed up testing the top of the channel (around 11:00 (Central/9:00 am PT).
- The market ended up testing back into the opening Trading Range (green box) and ultimately the open of the day (although it failed to touch the open of the day).
- Overall, the day was a trading range day. Often on days like today, the market will have a swing in one direction, followed by a swing in the opposite direction, which happened today. Days like today can be challenging because the reversals are never clear, and the probability is never as high as traders want. Trading ranges cannot have high probability stop entries or low probability stop entries. Most stop entries are between 40-and 60% and often are around 50%.
See the weekly update for a discussion of the price action on the weekly chart and for what to expect going into next week.
Trading Room
Traders can see the end of the day bar-by-bar price action report by signing up for free at BrooksPriceAction.com. I talk about the detailed S&P Emini futures price action real-time throughout the day in the BrooksPriceAction.com on trading room days. We offer a 2 day free trial.
Charts use Pacific Time
When I mention time, it is USA Pacific Time. The Emini day session charts begin at 6:30 am PT and end at 1:15 pm PT which is 15 minutes after the NYSE closes. You can read background information on the market reports on the Market Update page.
Thanks Brad – great analysis and breakdown!
Thanks Brad, I look forward to your early morning comment every day. It helps me get grounded and not get all worked up first thing in the morning. Have a great weekend!
Thanks Brad. You’re market review videos on YouTube have been a great help and I hope you find some time to make more after Al gets back!
thanks Brad. Analysis is very helpful!