Market Overview: Weekend Market Analysis
The SP500 Emini futures market has been sideways for 6 weeks in a yearlong strong bull trend, and therefore in Breakout Mode. Friday is a sell signal bar for a double top, but there will probably be buyers below. A bull breakout of the range is slightly more likely than a bear breakout due to bulls slight edge.
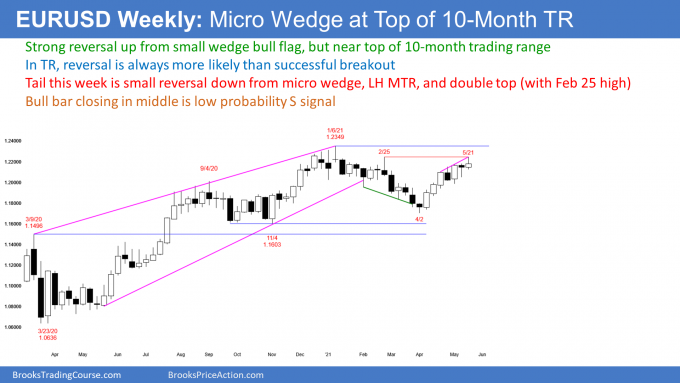
The EURUSD Forex market on the weekly chart has rallied strongly for 2 months. It is getting near the January 6 high at the top of the 10-month trading range, and there is now a micro wedge. Since the sell signal bar is weak and the bull channel is tight, there will probably be buyers below this week’s low.
EURUSD Forex market
The EURUSD weekly chart

- Bull bar but tail on top, and close in middle so reversal bar.
- Bull body so weak sell signal bar for micro wedge, lower high major trend reversal, and double top.
- Because 2-month rally is strong, if there is a reversal, it will probably stop at around the 1.20 Big Round Number, which has been important since August. There is a cluster of support there: 50% retracement; February 5 bottom of the January/February trading range; September 1 breakout point; and, May 5 low, which was the start of the parabolic wedge.
- Most attempts to break out of a trading range fail, even when the attempt is strong.
- A double top with the February 25 or January 6 high is more likely than a successful breakout above.
- The bulls need 2 closes above the January 6 high, to convince traders that the rally is a resumption of last year’s bull trend.
- Without that, they will continue to believe that the 10-month trading range is intact and that this rally is just a bull leg in that trading range.
- Weak sell signal bad, but micro wedge at resistance. When unclear like this, usually will not go far up or down.
S&P500 Emini futures
The Monthly Emini chart

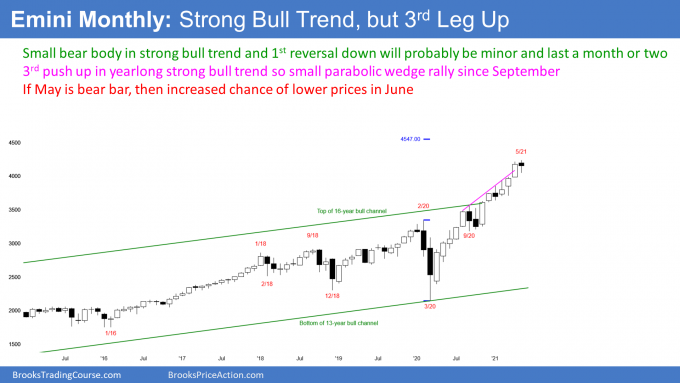
- Strong bull trend since pandemic low. Only 1 pullback (a bar that traded below the low of the prior bar), and it lasted only 1 bar (September).
- With one week remaining in May, May so far has a small bear body.
- The bulls want May to be the 4th consecutive bull bar. Since that is extreme and it would be coming late in the yearlong bull trend, it will probably not be a sign that the trend will continue straight up for many more months.
- More likely, the bulls will feel exhausted within a few bars (months), and start to take profits. Traders should expect a small pullback this summer.
- This is the 3rd leg up. There were pauses in September and January. If May has a bear body, it would be a sell signal bar for a parabolic wedge buy climax.
- It would be a higher probability sell signal bar if it closes near its low.
- Because the bull trend is extremely strong, a reversal down would probably only last 2 or 3 months before the bulls return.
- Since the yearlong rally has been so unusually strong, the correction might lead to a trading range for a year or more.
The Weekly S&P500 Emini futures chart

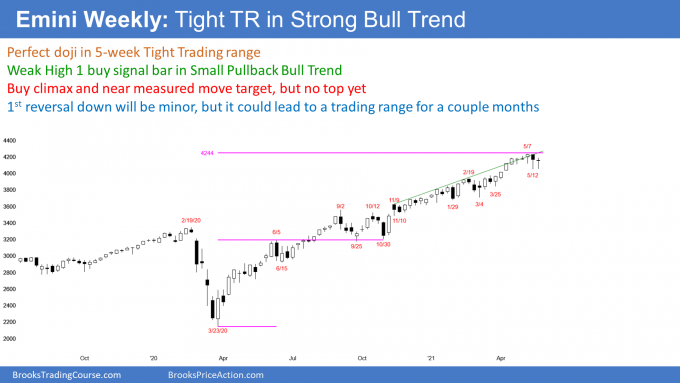
- I mentioned last week that there are consecutive outside bars on the Globex weekly chart, and that is an OO pattern. An OO is a Breakout Mode pattern, which typically has a 50% chance of a bull breakout, and a 50% chance of a bear breakout.
- The high of last week’s Globex OO bar is at the top of the 6-week range, and its low is at the bottom.
- On the above weekly chart of the day session, the pattern is similar. There is a 6-week trading range, which is also a Breakout Mode pattern.
- This week was an inside bar. It is a High 1 buy signal bar for next week. Since it was a perfect doji bar, it is not a strong High 1 bull flag buy signal bar for next week. This makes a strong rally next week less likely.
- Since it is an inside bar after a reversal down, it is also a Low 1 sell signal bar.
- A doji in a tight trading range in a Small Pullback Bull Trend is a low probability sell signal.
Late in Small Pullback Bull Trend
- The Small Pullback Bull Trend has lasted more than 60 bars, which is unusual and therefore will probably not continue much longer.
- Since there is no reliable top yet, traders expect higher prices.
- When a Small Pullback Bull Trend ends, it usually does not immediately reverse into a bear trend. A strong bull trend typically transitions into a trading range, before the bears can get a trend reversal.
- Once there is a correction, traders will expect it to last longer, and fall more than any prior pullback in the trend.
- The biggest correction so far was a 10% drop that lasted for 2 months (September and October). Therefore, once this Small Pullback Bull Trend ends, there should be a pullback that falls 10 to 20%, and it should last at least a couple months.
- It could last many months. For example, the Emini went sideways for 2 years after the 2017 buy climax.
- Once there is a trading range, it will have both buy and sell setups, as all trading ranges do.
- If the trading range has a reasonably good sell setup, the bears will have a 40% chance of a reversal into a bear trend.
The Daily S&P500 Emini futures chart

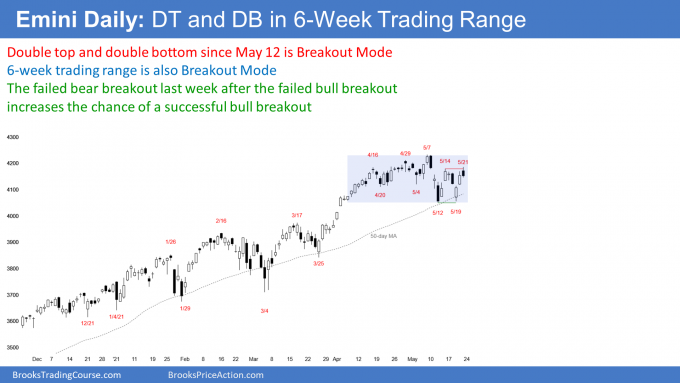
- Trading range for 6 weeks within yearlong bull trend. Most attempts to break out of a trading range fail, and the trading range can last longer than what seems likely.
- Traders are looking for a measured move up to 4,400 or down to 3,850, based on the 200-point tall trading range.
- Reversed up on Wednesday from a double bottom with last week’s low. This week formed a higher low, which is bullish.
- The consecutive big bull bars this week are also bullish.
- The bulls on Friday got a breakout above the May 14 high, which is the neckline of the double bottom, but Friday closed near the low of the day, and below the breakout point.
- Friday is a sell signal bar for a higher high double top with the May 14 high.
- The daily chart now has both a double top, and a double bottom since the May 12 low. That is a Breakout Mode pattern, and it is within the 6-week trading range, which is a bigger Breakout Mode pattern.
- A Breakout Mode pattern means that the probability of a successful bull breakout, is about the same as for a successful bear breakout.
- In this case, the probability is slightly higher for the bulls: the chart has been in a bull trend for a year; Friday has a smaller bear body than the bodies of the consecutive bull bars of the prior 2 days; and, last week reversed down from above the month-long trading range, but then reversed up from below, and a 2nd reversal is more reliable.
- Summary: 6-week trading range is Breakout Mode, as is the double top following the double bottom of the past 2 weeks. The probability of a bull breakout is slightly higher than for a bear breakout.
Trading Room
Traders can see the end of the day bar-by-bar price action report by signing up for free at BrooksPriceAction.com. I talk about the detailed Emini price action real-time throughout the day in the BrooksPriceAction.com trading room. We offer a 2 day free trial.
Charts use Pacific Time
When I mention time, it is USA Pacific Time (the Emini day session opens at 6:30 am PT, and closes at 1:15 pm PT). You can read background information on the intraday market reports on the Market Update page.
Hi Al. What are your thoughts on the bond market? Is May 19th more likely the start of a HL MTR or the DT sell off since Aug 6, 2020 should get another leg down eventually? Thank you.
Everyone knows bonds are going down for the next decade. But will they go down this week? They have been is a tight range.
The Fed keeps saying interest rates are not going up, and many institutions are betting on that. At least for the next year. But rates are going up… a lot.
I have been saying that they will be higher in 5 years and in 10 years, but bonds have fallen a lot over the past year. They could bounce 50% at any time. It would just take some unexpected financial disaster. Like what? A surprise is not a surprise if people know what it is. A panic rally only happens because something no one expected happens. Black swans are real, and I have seen many in 35 years as a trader.
So, yes, bonds are going down, and they are going very far down. They are in the early stage of a bear trend that will last a decade o more. But, they are currently in Breakout Mode and they are oversold. They therefore can rally for several months this year.
That’s what make is difficult for the bears. A trend that will last at least 10 years will have several rallies that will last a year or more.
Thanks Al. Yeah no one could predict what might trigger a surprise bond rally if it happens. The longer term charts are still very bearish with no bottom in sight.
Perhaps the pandemic recovery expectations that everybody anticipated and positioned for is overblown. Maybe the fed knows this and the inflation numbers are really transitory like they kept saying.
There might be some kind of liquidity problems too to trigger the black swan event. Fed’s yearlong QE infinity might be locking up a lot of liquidity in the commercial banking sector but little appetite to lend or borrow in the real economy. And then there’s all the weirdness in repo market with collateral shortage, negative overnight rates etc. Plus all the debt raising due to fiscal policy will probably sponge up a lot of dollars from overseas. The long in short of it is if EURUSD stays in the TR and maybe a DT with Feb 2018 then there should be a bear leg on that chart soon.
Just some thoughts for entertainment. I’m hoping E mini finally gets that 10% – 20% correction soon. But right now it looks like it’s about to climb that wall of worries again.
Al, I see a failed breakout of a triangle at the top on the daily emini. we have had one leg down in a spike. Am thinking we get a second to close the gaps
That is correct, but the reversal up from the bottom was strong enough to be a failed breakout below, and a 2nd failed breakout has a slightly higher chance of leading to a trend.
Thanks for the quick reply..so would you then think this is a situation requiring a second entry before a short.
Thanks for the weekend report Al. I was wondering your thoughts on the Bitcoin selloff?
Whenever there is a surprisingly big bar up or down, there is usually at least a small 2nd leg sideways to down. It often leads to 3 legs down (wedge) and a measured move.
The bears created a double top lower high major trend reversal sell signal on Friday. Every major trend reversal setup with a good signal bar has a 40% chance of leading to an actual reversal of the trend. That means 60% chance of more sideways or up.
There is a 45% chance of a break below the May low, but only a 40% chance it will lead to a bear trend. It is more likely to lead to a couple weeks down, which would not be a bear trend on the daily chart.