Trading Update: Wednesday March 23, 2022
Emini pre-open market analysis
Emini daily chart
- Emini bulls now have six consecutive bull closes on the daily chart.
- The odds are today will have a bear close below open, and the market will pullback for 1-3 days.
- So far, this is a strong enough rally to make the market always in long, and the first reversal down will likely be minor.
- Traders should expect a second leg up after and pullback.
- The next target for the bulls is the February 9 high and the 4,600 big round number. The bulls have enough momentum that the market will probably have to get there.
- The bears expect a second leg up, and they want the second leg to form a micro double top around the February 9 high. If the market forms a double top with the February 9 high (preferably if a double top nested within a micro double top), it would be a large double top lower high major trend reversal for the bears. They would have at least a 40% chance of getting a selloff to the February low.
- It is important to remember that this rally is within a trading range, so traders do not know how many bears are waiting to sell. This means bears could come in aggressively at the 4,600 price level or even the 4,800 price level (the all-time high).
- Overall, traders should expect today to have a bear close and the market to form a 1-3 day pullback on the daily chart. The pullback maybe 1-3 days of sideways and not go that low.
Emini 5-minute chart and what to expect today
- Emini is down 25 points in the overnight Globex session.
- The Globex market has sold off for most of the session and is forming a trading range within yesterday’s trend from the open.
- Overall, traders should expect the market to close as a bear day ending the 6-day consecutive bull rally on the daily chart.
- Traders should expect mostly a trading range day and look to buy in the bottom half, sell in the top half, and scalp. Also, traders should avoid trading in the middle of the trading range (poor math).
- If traders are not comfortable scalping, they should wait for a credible stop entry such as a double bottom/top or a wedge bottom/top, or wait for a strong breakout with follow-through.
- If the market is above the open late in the day and not far from it, traders should be aware of a likely selloff testing the open of the day.
Yesterday’s Emini setups

Al created the SP500 Emini charts.
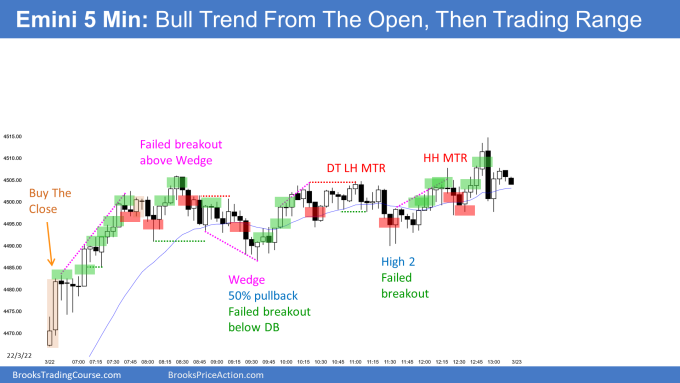
Here are several reasonable stop entry setups from yesterday. I show each buy entry with a green rectangle and each sell entry with a red rectangle. Buyers of both the Brooks Trading Course and Encyclopedia of Chart Patterns have access to a much more detailed explanation of the swing trades for each day (see Online Course/BTC Daily Setups).
My goal with these charts is to present an Always In perspective. If a trader was trying to be Always In or nearly Always In a position all day, and he was not currently in the market, these entries would be logical times for him to enter. These therefore are swing entries.
It is important to understand that most swing setups do not lead to swing trades. As soon as traders are disappointed, many exit. Those who exit prefer to get out with a small profit (scalp), but often have to exit with a small loss.
If the risk is too big for your account, you should wait for trades with less risk or trade an alternative market like the Micro Emini.
EURUSD Forex market trading strategies
EURUSD Forex daily chart

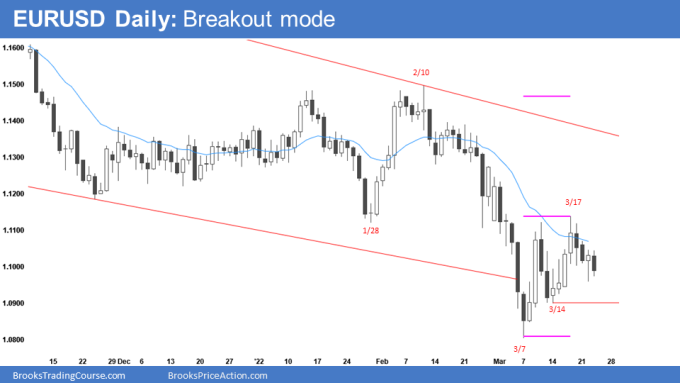
- The bears have a credible double top forming a negative gap at the 3-month trading range low.
- The bears hope they can get a bear breakout testing the March 7 higher low. If the market does sell off, it will likely form a double bottom higher low at the March 14 low.
- The bear’s problem is that the market is in a trading range, and the double top bear flag the bears have is at the bottom of a channel. This means that there is a greater risk that the bulls will get a bull breakout of the bear flag (March 7 – March 17).
- The bears got a bad entry bar following the bear signal bar on March 21. This is a further sign of trading range price action.
- It is important to mention that double tops often have bad follow-through, and still 40% of the time (in general), they lead to a test of the low and try for a measured move down.
- So as unlikely as it seems, the bears still have a chance at a break below the March low, although it is not likely.
- Overall, traders should expect more sideways over the next couple of days as the market decides on the double top or the bull breakout of the bear flag.
Summary of today’s S&P Emini futures price action and what to expect tomorrow

Al created the SP500 Emini charts.
End of day summary
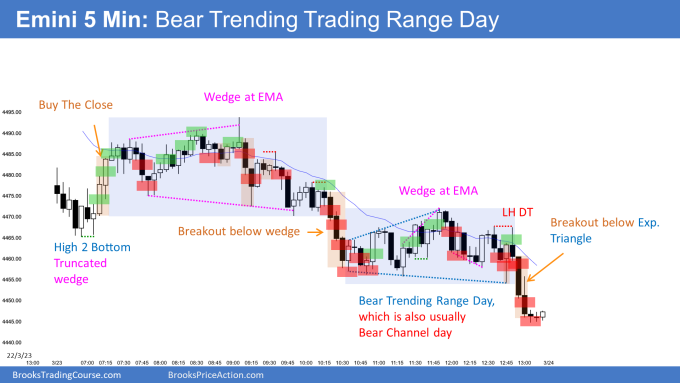
- Today closed as a bear day on the daily chart, which ended the 6-day bull streak.
- The market triggered a low 1, which will probably find buyers tomorrow or Friday and continue sideways to up.
- On the open, the bulls got a wedge bottom that tested the low of yesterday.
- The overlap on the first six days showed that the market was likely to be a trading range day.
- The breakout at 7:15 am made the market always in long. However, the moving average was just about it, and the market had a big gap down on the open. These reasons increased the market’s odds, going more sideways than up.
- By 9:05 am, the market formed a wedge top. The bulls tried several times to get follow-through after the bull breakout at 7:15 am.
- The bulls gave up two bars later, and the market-tested back down to the open of the day.
- The bears tried to form a bottom at 9:45 am. However, the bears got a breakout that led to more sideways price action.
- Overall, today formed a wedge top that led to a trading range, which followed a bear breakout around 10:30. This breakout leads to another trading range, so that one would call it a trending trading range day.
See the weekly update for a discussion of the price action on the weekly chart and for what to expect going into next week.
Trading Room
Traders can see the end of the day bar-by-bar price action report by signing up for free at BrooksPriceAction.com. I talk about the detailed S&P Emini futures price action real-time throughout the day in the BrooksPriceAction.com on trading room days. We offer a 2 day free trial.
Charts use Pacific Time
When I mention time, it is USA Pacific Time. The Emini day session charts begin at 6:30 am PT and end at 1:15 pm PT which is 15 minutes after the NYSE closes. You can read background information on the market reports on the Market Update page.
Hi Brad, why would would bars 1 & 2 not trigger a sell signal after the gap-down on the opening? I sold the close of bar 2, was disappointed by bar 3 and got out for a small profit on bar 4. Just wondering why I saw it as a sell when clearly other price-action traders did not. Thanks!
I think I see this as more of a pullback and a High 2 opening now after seeing the previous day’s bullish price-action. Had the prior day been bearish maybe a sell there would have made more sense on a gap down.
Hi Brad, why is bar 44-45 a potential buy the close? The 45 looks more like a L2 to me, it is at the top of a bear channel, below the 20EMA and after a series of dominant bear bars.
Note: I bought @ the close of bar 33 at midpoint, expecting the bear BO to fail, bar 45 is the high of bar 33’s close, final window to exit that long
Bar 44-45 was a second entry buy at the bottom of the expanding triangle. it was a reasonable swing buy betting on a higher low major trend reversal. When the market went below it the bulls gave up which is why the bears got their breakout on 46-48.
Thanks for the great report and super work Brad!
I assume in both paragraphs 3 & 8 you have meant to say bulls got wedge bottom and bulls tried to form a bottom right?
Question re ledge – bars 11-14 formed an identical open/close value, could that have been considered as ledge or ledge is being made from an identical high/low mainly?
Very clear and wonderful. Thank you, Brad, keep up the super work.
Thank you Itai. Glad they are helpful.