Trading Update: Thursday August 4, 2022
Emini pre-open market analysis
Emini daily chart
- Yesterday got within 8 points of the June high. It will probably have to reach it today or tomorrow.
- Once the market reaches the June 2nd high, Emini likely sideways around that price level.
- The bulls got the minimum for a second leg up after the three-bar breakout ending on July 29th.
- The bulls want a strong breakout above the June 2nd high, which is unlikely. The market is beginning to go sideways, back at the same price level as the June 2nd tight trading range. This is a sign that the market views this price level as fair.
- Another reason the odds favor sideways is that June 2nd has been a major lower high in a broad bear channel since early 2021. Typically, when the market goes above the most recent major lower high, the market forms a trading range.
- Also, the rally up to August is becoming climactic and forming wedge tops, increasing the odds that the market will have to pull back for a few legs and create a higher low.
- Lastly, most swing bulls probably want to see a pullback appear weak and buy a higher low. If the market does not pull back and breaks far above the June 2 high, traders will be happy to buy.
- Bears want the August rally to form a double top with June 2nd, break below the neckline (June 17), and fall 500 points lower (size of the double top). This would be a low probability event (20%).
- More likely, the market will attempt to form a double top and selloff in a way that is confusing for both the bulls and the bears, which would increase the odds of trading range price action.
- The bears need to develop more selling pressure, but if they are successful, traders will begin to sell, especially if the bears can get consecutive bear bars closing on their lows.
- Overall, traders should expect the market to go sideways here.
Emini 5-minute chart and what to expect today
- Emini is up 2 points in the overnight Globex session.
- The market has been in a trading range for most of the Globex session.
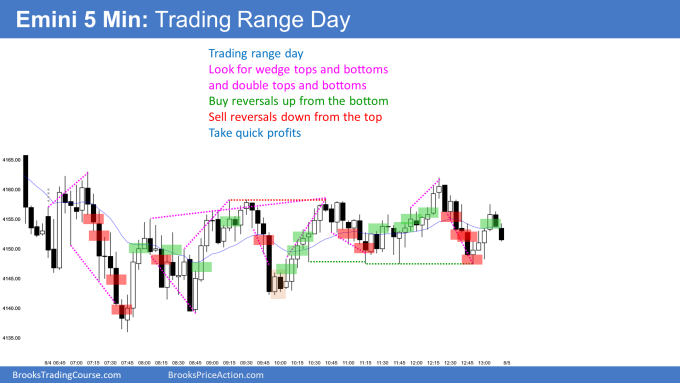
- Traders should expect today to have lots of trading range price action on the open.
- Yesterday ended with consecutive buy climaxes, meaning there is a 75% chance of two hours of sideways trading beginning before the end of the second hour.
- There is a 50% chance the open will have continued buying on the open and then form a trading range for at least two hours.
- Traders should expect a trading range until proven wrong as they see a strong breakout with follow-through.
- Most traders should consider waiting for 6-12 bars before placing a trade since the open usually have multiple reversals during the first hour.
- Traders can wait for a breakout with follow-through or a credible stop entry on the open, such as a double top/bottom or wedge top/bottom.
- The most important rule is to not be in denial about what is happening. If the market is in a trading range, treat it like a TR; if the market is in a Trend, treat it like a trend.
Yesterday’s Emini setups

Al created the SP500 Emini charts.
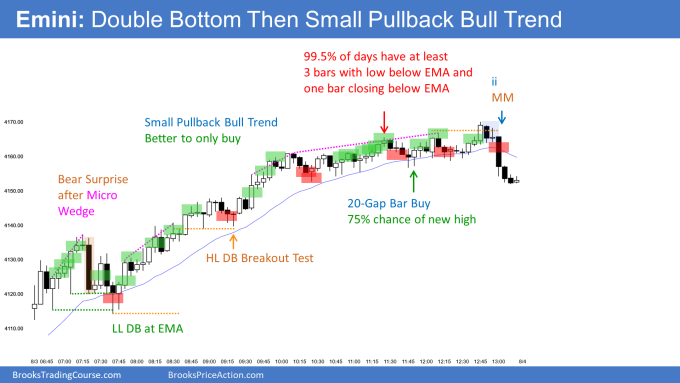
Here are several reasonable stop entry setups from yesterday. I show each buy entry with a green rectangle and each sell entry with a red rectangle. Buyers of both the Brooks Trading Course and Encyclopedia of Chart Patterns have access to a much more detailed explanation of the swing trades for each day (see Online Course/BTC Daily Setups).
My goal with these charts is to present an Always In perspective. If a trader was trying to be Always In or nearly Always In a position all day, and he was not currently in the market, these entries would be logical times for him to enter. These therefore are swing entries.
It is important to understand that most swing setups do not lead to swing trades. As soon as traders are disappointed, many exit. Those who exit prefer to get out with a small profit (scalp), but often have to exit with a small loss.
If the risk is too big for your account, you should wait for trades with less risk or trade an alternative market like the Micro Emini.
EURUSD Forex market trading strategies
EURUSD Forex daily chart

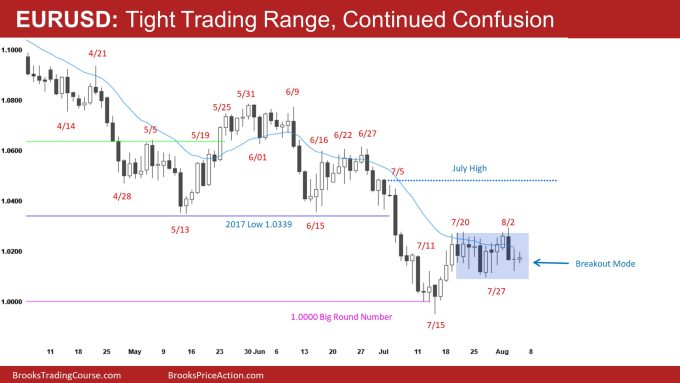
- The EURUSD is continuing the tight trading range price action.
- At the moment, the probability is 50% for a breakout up or down.
- The market is in the middle of two important price levels. It is common for the market to begin to go sideways as traders decide on which magnet to test.
- Ultimately, it would be better for the bulls if the market sells of back to the 1.0000 big round number and then rallies back to the 2017 lows.
- If the bulls form a double bottom with the July 14th low, it could give them a reasonable chance at breaking above the neckline (August 2) and getting a measured move up to the June 27th high.
- The bears want the opposite and for the market to create a double top and successful breakout below the neckline (July 14).
- Overall, the market is in a tight trading range, and until there is a breakout, there is no breakout. Most traders should wait for a strong breakout with follow-through as this is currently a limit order market.
Summary of today’s S&P Emini futures price action and what to expect tomorrow

Al created the SP500 Emini charts.
End of day video summary
See the weekly update for a discussion of the price action on the weekly chart and for what to expect going into next week.
Trading Room
Traders can see the end of the day bar-by-bar price action report by signing up for free at BrooksPriceAction.com. Al talks about the detailed S&P Emini futures price action real-time throughout the day in the BrooksPriceAction.com on trading room days. We offer a 2 day free trial.
Charts use Pacific Time
When times are mentioned, it is USA Pacific Time. The Emini day session charts begin at 6:30 am PT and end at 1:15 pm PT which is 15 minutes after the NYSE closes. You can read background information on the market reports on the Market Update page.
Brad, I like the video reviews. Keep up the great work!
Thanks Brad for the video. Indeed classical TR day. Wondering from which bar during the session you can sort of confidently works under the assumption this is a TR day and you need to look for wedges alongside DT/DB?
In general, I always assume the day will be a trading range day until I see consecutive tend bars.
For example, on August 5th I was assuming the open would be a trading range, however bars 1 and 2 were two strong trend bars, therefore my premise of a trading range is no longer valid, and the market is in a buy the close rally which means I need to get long for at least a 2nd leg up.
To answer your question, I keep it simple and assume we will need a double top/bottom, wedge top/bottom, or a strong breakout with follow-through, and I look for one of those to form until it does.
Like your thinking, thanks.
At what bar was it clear that it was a trading range day?
it was clear by the first 6 bars of the day. Just look at how much disappointment stop entries faced. Traders sold below bar 1 then they had the bar 3 large bull reversal up. Bulls who bought bar 3 had more than a 50% pullback they had to sit through. This is a limit order market.
How one can figure out if it is a trading range or trend, it starts with understanding if limit order or stop order traders are trapped. Stop order traders get trapped in a trading range and limit order (counter trend) traders get trapped in a trend.
Thank you for that insight regarding limit and stop orders.
Brad, Was there any indication not to sell the close of bar 2?
Generally, two consecutive trend bars are the minimum for Sell the close/buy the close. However, one must look at the context. Today was likely to form a trading range after yesterday’s consecutive buy climaxes into the close, and bar 2 had an upper tail larger than the body, which increases the risk of bar 2 being a trading range bar more than a trend bar.
Ahh thank you for that context, Brad. I found bar 2 compelling because of that tail on top, seeing it as a failed reversal attempt by the bulls and subsequent bearish finish. Bar 3 was surprising in that it seemed the entire market knew it was time to reverse. Thanks!
I agree with you Brad. it seems market could form spike and channel bull trend on the daily chart and the third leg could test June 2nd and form a double top with June 2nd. And as you mentioned above if it breaks up strongly, traders will be happy to buy or it could pull back and test the beginning of the channel (BO test) and even forms micro wedge bull flag. However, line chart shows that the trend’s formed wedge bear flag already. So excited to see what happens