Trading Update: Monday April 4, 2022
Emini pre-open market analysis
Emini daily chart
- The Emini has had a pullback over the past few days following the strong rally from the March 14 low. The odds are the Emini is likely to bounce with a rally over the next day or so due to bears buying back shorts and bulls establishing long positions for a bounce up.
- The selloff over the past few days was due to profit-taking from the rally. The market is in an overall trading range on the daily chart, so this will make traders not want to buy above apparent resistance levels such as the February high. This means bulls will be interested in taking profits on strength.
- While the odds favor a second leg up from the March rally, traders have to question the strength of the March 31 bear breakout bar. It is a surprise bar, which may lead to a small second leg down.
- March 31 may be strong enough to make the next several trading days lead to a tight trading range instead of leading to a strong second leg up.
- Put yourself in the bull’s perspective and pretend you bought the March 29 high bull close and ask yourself, are you disappointed with the three-day pullback, especially on March 31? Of course, you are. This means you will likely be happy to exit around breakeven regardless of if you scaled in lower. The bears also know this and will look to short around that same area (March 29 high).
- One thing to remember is that the bears are still likely just scalping and not shorting for a swing trade. The bull channel is still too tight, and the bears will need at least a double top with the March 29 high at a minimum.
- This week will probably go sideways between the 4,600 and 4,500 price levels.
- Traders should expect a bounce over the next day or two that will probably fail to reach the March 29 close on the first reversal up.
Emini 5-minute chart and what to expect today
- Emini is up 10 points in the overnight Globex session.
- The Globex session had a strong rally last night, followed by a sharp selloff, and now the market is back at the Globex high. This is big up, big down, so sideways likely.
- The bulls will probably get a bull close today due to bears taking profits on the 3-day pullback (daily chart) and the bulls buying the pullback for a bounce.
- As usual, traders should expect a trading range on the open and be patient. If there is going to be a breakout on the open that will lead to a strong trend, there will be plenty of time to enter.
- Traders should wait for a credible stop entry or a strong breakout with follow-through.
Friday’s Emini setups
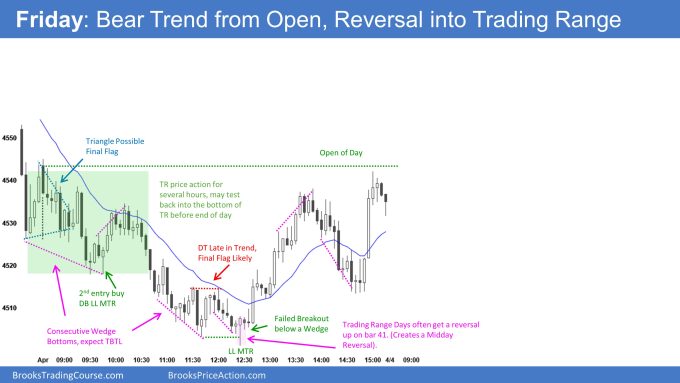
- Al Brooks on London PA Symposium and overseas break.

Emini charts created by Brad. Al will be back on April 11, 2022
EURUSD Forex market trading strategies
EURUSD Forex daily chart

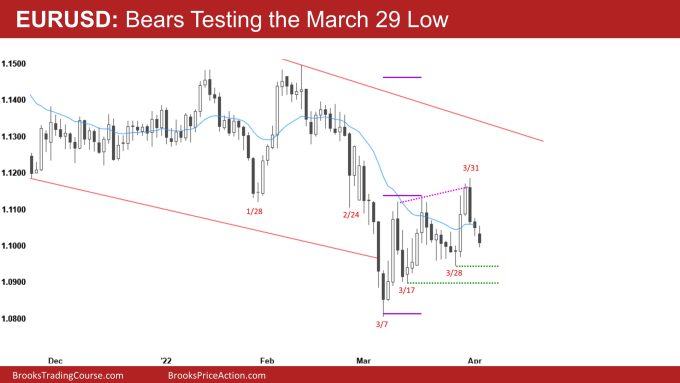
- The EURUSD formed a wedge top on March 31, which was a bear bar closing on its low.
- The entry bar on April 1 was a bear bar. Although it was a small bear bar, it is still a bear bar which is good for the bears.
- So far, today has broken below April 1’s low. The bears want the market to reach the March 28 low, the bottom of the most recent bull leg.
- The bulls want this selloff to be another higher low in the bull channel.
- Traders need to be open to the market having to test down to the Marcy 28 low or the March 14 low and form a double bottom higher low major trend reversal.
- While the market may reach the March low, the odds are that any test of the March low will find buyers.
- The odds still favor an upside bull breakout. The problem is that traders do not know the path of the bull breakout. Will the market reverse up within a few days and get the upside breakout, or will the market have to test lower such as one of the March higher lows or even the March low.
Summary of today’s S&P Emini futures price action and what to expect tomorrow

Emini charts created by Brad. Al will be back on April 11, 2022
End of day summary
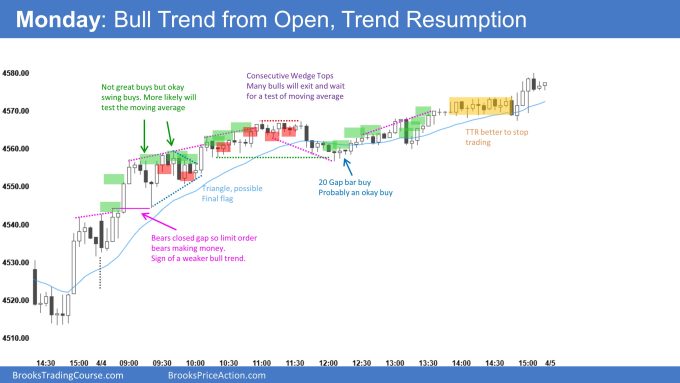
- The Emini gapped up on the open and continued sideways with the prior day’s closing range for a few bars.
- The bulls got a bull breakout on bar 5 that led to sideways to up price action for most of the day.
- While the 2-bar bull breakout around 9:00 (Central time on chart/7:00 PT) was strong, it was far from the moving average, which increased the odds of sideways trading.
- The reason for this is that the moving average implies an average price, and if the market is above the moving average, traders are being forced to buy above-average price action. Since most days test the moving average early in the day, traders were hesitant to buy far above it since the market would test back to the open at some point soon.
- The bulls kept getting buy signal bars around 10:00 (on chart /9:00 PT). However, the market was so close to the moving average traders expected the market to get there, which made traders hesitate to buy above them.
- The point I am making about the moving average is that you can often get in at a better price on the open if one looks to buy on a pullback to the moving average. The risk of waiting for a pullback to the moving average is that you miss a trend that goes a long way.
- There were no clear swing shorts today, the red boxes are places bulls may exit and aggressive bears may sell.
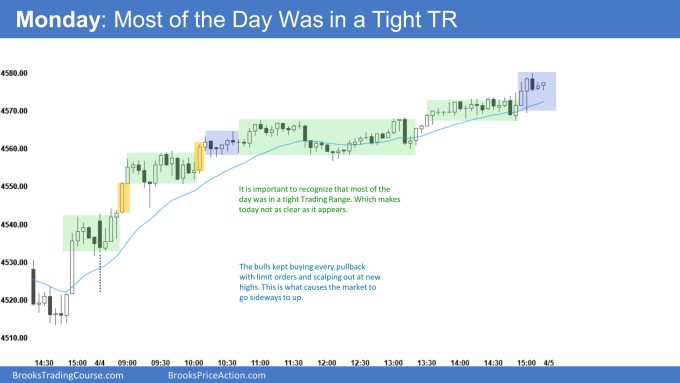
- Today is challenging because while it is a small pullback bull trend and the channel is tight, most of the day was trading range price action. I posted a separate chart below to better visualize just how much of the market was sideways. If you remove the two bars in yellow (bull breakout bars), all 81 bars had overlap.
- These days are incredibly challenging because the trend is mostly sideways and not all that clear. The follow-through is weak by the time you get a good bull breakout, and the market continues sideways.
- The stop entry buys are also unclear. Look at the chart’s stop-entry buys market (green boxes). The problem is that the probability is not all that high because of all of the trading range price actions. You can take any of these buys for a swing, but most of them are challenging to manage as a scalp.
- Overall, the market reversed most of the March 31 bear bar. The bulls will hope tomorrow is another strong bull close, increasing the odds of higher prices on the daily chart.
Note that the below chart is to illustrate how much of the market was in a tight trading range.*

See the weekly update for a discussion of the price action on the weekly chart and for what to expect going into next week.
Trading Room
Traders can see the end of the day bar-by-bar price action report by signing up for free at BrooksPriceAction.com. I talk about the detailed S&P Emini futures price action real-time throughout the day in the BrooksPriceAction.com on trading room days. We offer a 2 day free trial.
Charts use Pacific Time
When I mention time, it is USA Pacific Time. The Emini day session charts begin at 6:30 am PT and end at 1:15 pm PT which is 15 minutes after the NYSE closes. You can read background information on the market reports on the Market Update page.
Thanks Brad, great demonstration of different chart perspectives. Despite the challenges on this day, my point of reference remained the “spike” at bar 2- 6, which indeed turned out to be a perfect measured move to the end’s close. Scaled in during the pullbacks accordingly.
Brad, there are a few of us in a discord channel jokingly referring to you as “Brad the Oracle”. I appreciate your premarket analysis very much. If you were up to it, it would be amazing if you could do video on how you prepare for the trading day and routine checklist on what gives you a feel for the upcoming day? (I have subscribed to your Youtube channel if you decide to do them) Thanks again!
Glad they are helpful. Soon, I will try to get a video about how to prepare for the trading day.
My experience is that the more you study, the more things make sense, and the less you “prepare” for the day. Don’t take that the wrong way because you always need a game plan. My point is that it becomes easier to decide what you should look for during the day as you spend more time studying the material and looking at charts.
I will make a note to create a video over this, though.
Brad
Is the discord’s focus on the BTC material and price action trading? I have been looking for something like that.
If you go to the top of the page: members area –> Facebook Al Brooks BTC Study Group and join that group. Post about looking for the discord and someone will give you an invite link. If I post on here it will be spammed with bots.
Hi Christian, would you kindly share an invite for the Discord channel? I’d be happy to join there.
If you go to the top of the page: members area –> Facebook Al Brooks BTC Study Group and join that group. Post about looking for the discord and someone will give you an invite link. If I post on here it will be spammed with bots.