Market Overview
The Emini weekly chart has had 9 consecutive bull trend bars. This is rare and climactic. It is getting drawn to the triple top on the daily chart that is just above 2,800. Because the rally is extreme, bulls will soon take some profits. This will soon create at least a 50 point pullback lasting 2 – 3 weeks.
Crude oil has rallied strongly over the past 2 months. It is in a resistance zone between the 20 week EMA and $60. The rally will probably pull back for several weeks once it gets closer to $60.
The EURUSD Forex market has been in a tight range for 4 months. This is unusual and therefore there will probably be a breakout soon. The market is sideways because the bulls and the bears are balanced. Consequently, there is a 50% chance of the breakout being up or down.
Crude oil Futures market:
Strong minor reversal up to near resistance
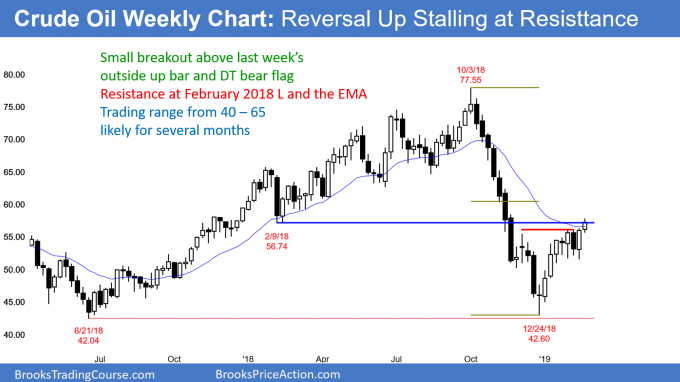
The crude oil futures chart broke above last week’s outside up bar and the 20 week EMA. However, this week was a small bull bar. This is therefore a weak breakout and unlikely to lead to much higher prices.
The 5 week tight trading range is an area of agreement. Consequently, it is a magnet. Although the current rally might continue to the 50% retracement level at around $60, it will then probably get pulled back into the tight trading range.
As strong as the current rally has been, it is the 1st leg up from a strong selloff. A trading range over the next many months is more likely than a bull trend. The rally is simply searching for the top of the range. The top might be $65 or more, but probably not much more.
A Big Down, Big Up move creates Big Confusion. That is a hallmark of a trading range. Crude oil will probably stay between $40 and $65 for many months and possibly all year.
EURUSD weekly Forex chart:
Apex of wedge, in Breakout Mode
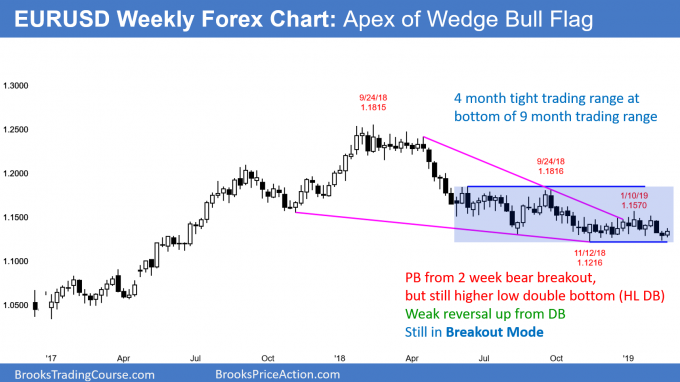
The EURUSD weekly Forex chart has been selling off for the past year. After a 4 month trading range, the bears are hoping that the past 2 weeks is a resumption of that bear trend.
However, there was a bull body this week. While last week was the 2nd consecutive bear bar, its low was above the November low. Furthermore, it had a big tail below and it closed above the November and December lows.
The market is simply waiting for a catalyst, and the obvious one is the Brexit deal. When a chart is in breakout mode like this, there is a 50% chance of the breakout being up or down. Furthermore, there is a 50% chance that the initial breakout fails and reverses. Until there is a clear breakout, traders will continue to look for reversals every couple weeks.
Monthly S&P500 Emini futures chart:
Strong rally to middle of yearlong trading range
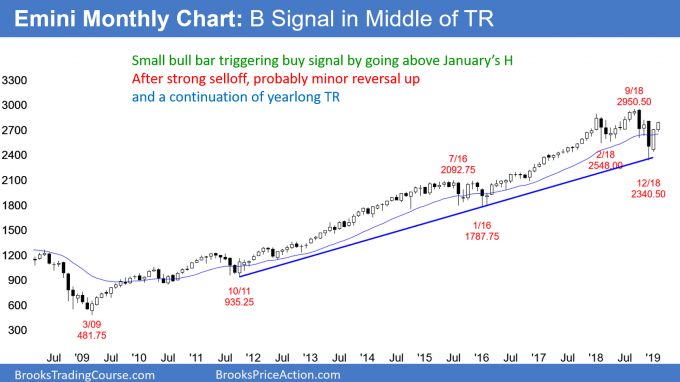
The monthly S&P500 Emini futures chart has rallied over the past 2 months. However, the bull bar in February is much smaller than that in January. Furthermore, the rally might simply be a buy vacuum test of the top of huge bear bar in December. Finally, the 3 month selloff last year was huge and the current rally has retraced only a little more than half.
Therefore, as strong as the rally has been, it is still only a bull leg in a yearlong trading range. Seven of the 14 last bars have been between 2,600 and 2,800. Consequently, that range is an important magnet. Traders should therefore expect the monthly chart to be there for more bars this year.
This is true even if the current rally continues up to a new all-time high. The rally will probably have a hard time escaping the gravitational pull of that area of agreement. As a result, there will probably be more sellers than buyers above last year’s high. There is no sign yet that the Emini is about to break free of last year’s trading range.
Weekly S&P500 Emini futures chart:
9 consecutive bull bars so unsustainable
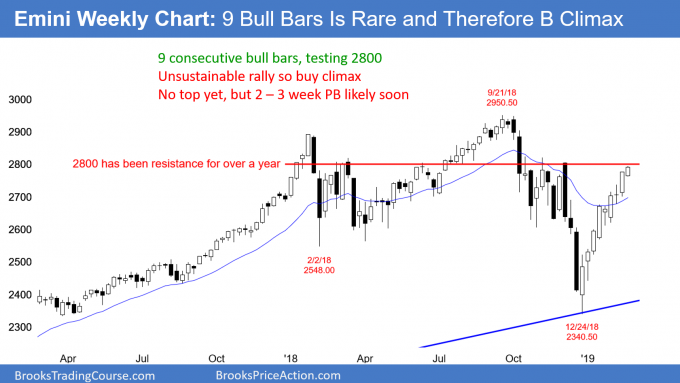
The weekly S&P500 Emini futures chart had bull bodies for each of the prior 9 weeks. This is unusual and therefore unsustainable and climactic. I could find only one instance in the past 20 years of a streak of more than 9 consecutive bull trend bars on the weekly chart. There were 2 streaks of 9 bars. Each streak of 8 or 9 consecutive bull trend bars led to at least 2 – 3 weeks of sideways to down trading.
Furthermore, Carter Worth on CNBC looked back at streaks of 8 bull bars with a 10% rally over the 120 year history of the Dow Jones Industrial Average, like what we have today. This has happened 15 times. Ten of the 15 times led to the S&P being lower one and two months later. The average decline was more than 2%.
However, there is no sign of a top. The odds therefore continue to favor at least slightly higher prices.
Bull micro channel is a climax, but it is a sign of strong bulls
This week’s low is above last week’s low. In fact, for the past 8 weeks, every low has been above the low of the prior week. This is a 9 week bull micro channel. While unsustainable and a pullback is likely, the bulls will be eager to buy below the low of the prior week. As a result, the 1st pullback will probably last 3 weeks or less.
Price action was stronger this week
Six weeks ago, there was a big bull bar closing on its high. The next week was a doji. Four weeks ago, there was another strong bull bar followed by a doji. Finally, 2 weeks ago was another strong bull bar. However, what happened this week? Instead of another doji bar, this week was also a bull bar closing near its high.
Why is that important? Because it is a change in the series of the past 6 weeks. Instead of another weak bar following a strong bar, there are now consecutive strong bars. Yes, this could represent a final climactic end to the rally. But, it also might lead to a quick 1 – 3 more weeks up before the bulls are exhausted.
Possible gap up on the weekly chart next week
This acceleration up increases a chance of a gap up next week on the weekly chart. Furthermore, with the December sell climax high only about 15 points above this week’s high, the Emini might even gap above that high. On the daily chart, that is the 3rd high in the triple top.
A gap above major resistance forces traders to make quick decisions. Many will place bets on what they expect to follow. The bulls will try to squeeze the bears, hoping for a quick 50 point rally.
Where are the bears?
While the bears have been absent for 2 months, they are still out there. They are waiting for some price that they believe is too high. Once there, they will sell.
Also, the bulls will take profits at some point. Resistance is an obvious possibility. Consequently, instead of a strong new leg up on a gap up, there is an increased chance that it will be a blow-off top and the end of the 2 month rally. If enough bulls take profits and enough bears sell, the Emini could easily fall 100 – 200 points over the next several months.
Even if that were to happen, the rally has been very strong. It is likely to be the 1st of at least 2 legs up this year. Therefore, even a 200 point selloff lasting 2 months will probably form a higher low. The odds are that the 2019 bull trend will test the all-time high at some point in 2019.
Daily S&P500 Emini futures chart:
Parabolic wedge buy climax just below 2800 resistance
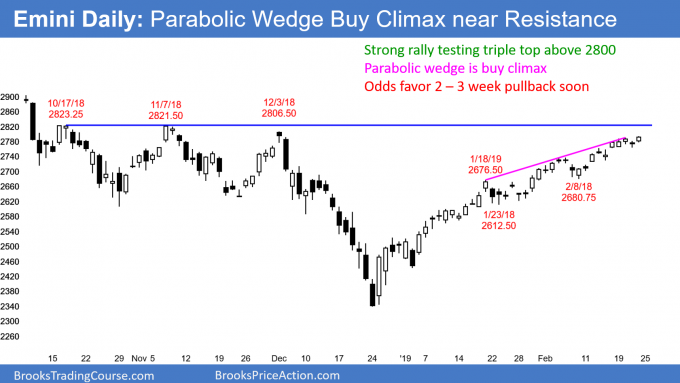
The daily S&P500 Emini futures chart has rallied strongly in a tight bull channel for 9 weeks. Because there are 3 legs up over the past 6 weeks, the rally is a parabolic wedge buy climax. However, most days are bull days closing above their midpoints. This makes at least slightly higher prices likely.
2800 is a strong magnet
The Emini has tested 2,800 many times during the past 15 months. July’s rally went far above. But, the Emini has been unable to hold above it. The October-November-December triple top is just above 2,800. Each of the 3 tops was an attempt to break above 2,800, and each failed.
The current rally is another attempt. This one is much stronger that the others. Therefore, the odds are that the Emini will successfully break above this resistance.
But when? Prior to this week, a 2 – 3 week pullback was likely to form before the breakout. However, the Emini over the past 2 weeks is getting vacuumed up to the target.
Buy vacuum test of resistance
In a buy vacuum test of resistance, traders see the momentum increasing as the market approaches the magnet. They conclude that the rally will reach the target. If you are a bear, why sell here when you believe you soon can sell higher? Therefore, there is a relative lack of sellers just below the target. The market will therefore race up in search of a price where the sellers will sell again.
If you are a bull, you are buying because you expect one of two things will happen. First, the rally continues up to the target and you make a profit. Second, there is a pullback.
But, when the bull channel is tight, as it has been, the bulls will buy the pullback. That includes bulls who are buying today at the high of the rally. They will buy more 20 – 50 points lower. Why? Because they correctly believe that the best the bears can get over the next month is a pullback in what will become either a bull flag or a trading range.
A trading range has bull and bear legs. After the 1st leg down, the bulls are confident of another leg up to where they most recently bought. That will allow them to get out without a loss. If they buy more during the pullback, they will make a profit on their lower entry.
What will happen next week?
The bulls will probably take profits around 2,800, or just above the triple top. Since many weak bears will exit above the triple top, it is now likely that the rally will break at least a little above it within a couple of weeks.
There is a small chance of a huge break above the triple top and a test of the all-time high. More likely, a break above the triple top will soon find sellers. The sellers will be bulls taking profits and bears betting that the profit-taking of the bulls will create a pullback.
Trading Room
Traders can see the end of the day bar-by-bar price action report by signing up for free at BrooksPriceAction.com. I talk about the detailed Emini price action real-time throughout the day in the BrooksPriceAction.com trading room. We offer a 2 day free trial.
Charts use Pacific Standard Time
When I mention time, it is USA Pacific Standard Time (the Emini day session opens at 6:30 am PST, and closes at 1:15 pm PST). You can read background information on the intraday market reports on the Intraday Market Update page.