Trading Update: Monday May 2, 2022
Emini pre-open market analysis
Emini daily chart
- Emini closed near its low last Friday, creating a strong bear close on the weekly chart
- The market is close enough and likely to reach February low (4,100.25) sometime this week.
- Bulls want to prevent the bears from reaching the February low and form a higher low.
- The bears have a reasonable shot at breaking below the February lows and testing the 4,000-round number.
- It is possible the bears get a measured move down from the February – March trading range which would project down to 3,600.
- Until there is a credible breakout below the February low, the odds favor more trading range price action.
- Overall, the market is 25 points away from the February low and is close enough that it may have to get there today. Traders should pay close attention to the February low as it will likely be an important magnet as the market decides to either break below or reverse up from it.
Emini 5-minute chart and what to expect today
- Emini is down 9 points in the overnight Globex session.
- The Emini is close enough to the February low that it may have to reach it today or tomorrow.
- Traders should pay close attention to the February low (4100.25) as it will likely be an important magnet.
- As always, traders should expect a trading range open and consider waiting for a credible stop entry or a strong breakout with follow-through.
Friday’s Emini setups

Al created the SP500 Emini charts.
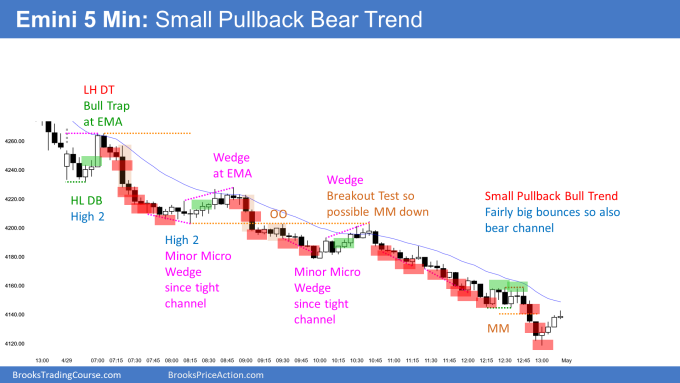
Here are several reasonable stop entry setups from Friday. I show each buy entry with a green rectangle and each sell entry with a red rectangle. Buyers of both the Brooks Trading Course and Encyclopedia of Chart Patterns have access to a much more detailed explanation of the swing trades for each day (see Online Course/BTC Daily Setups).
My goal with these charts is to present an Always In perspective. If a trader was trying to be Always In or nearly Always In a position all day, and he was not currently in the market, these entries would be logical times for him to enter. These therefore are swing entries.
It is important to understand that most swing setups do not lead to swing trades. As soon as traders are disappointed, many exit. Those who exit prefer to get out with a small profit (scalp), but often have to exit with a small loss.
If the risk is too big for your account, you should wait for trades with less risk or trade an alternative market like the Micro Emini.
EURUSD Forex market trading strategies
EURUSD Forex daily chart

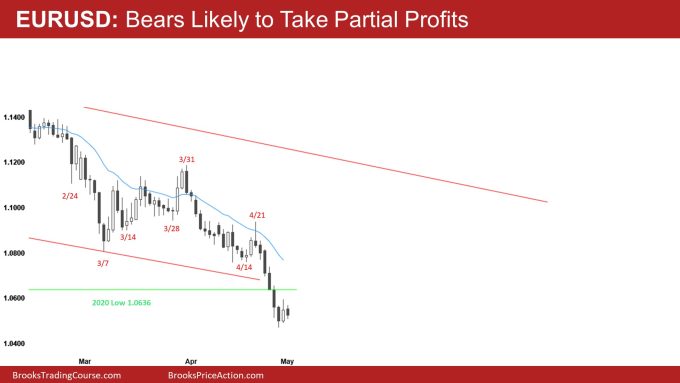
- The EURUSD will likely bounce for a few days as the bears begin to take partial profits.
- The market likely formed an exhaustive sell climax that started on April 21.
- The bears hope the selloff from April 21 will lead to a measuring gap; however, more likely, it will lead to profit-making and a rally back into the March – April trading range.
- The bulls will likely need at least a micro double bottom before they can get a credible reversal back into the 2-month trading range.
- The bears are close to the 2017 low (1.0339), and the market may have to reach it before it reverses back into the 2-month trading range.
- The market was only 130 pips away from the low of 2017. If it reverses up now without getting closer to the 2017 low, traders will question if this was an acceptable test. This means that if the market attempts to reverse up from here, it may not be able to escape the gravitational pull of the 2017 low and will have to reach it before it goes much higher.
- One thing to point out is that the market is in a trading range on the monthly chart. When the market is in a trading range, it will often go below one support level but not the next support level. The market went below the 2020 low and may not go below the 2017 low.
- The market will like to have to test the 2020 low soon. This is due to the scale in bulls who bought the 2020 and scaled in lower.
- Overall, traders should expect a minor reversal up soon as bears begin to take partial profits. Also, as I said above, the market will likely test the 2020 low here in the next day or two.
Summary of today’s S&P Emini futures price action and what to expect tomorrow

Al created the SP500 Emini charts.
End of day summary
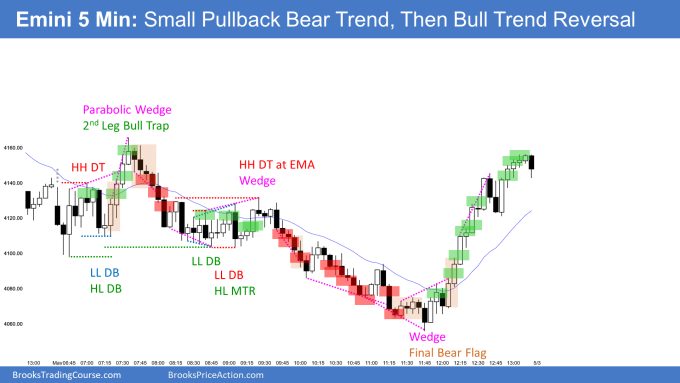
- The market tested the February low on bar 2 and reversed up in the form of a two-legged pullback up to 7:30 PT. This was also a second-leg trap.
- Often, when the market tests a higher time frame (daily chart) support or resistance level like the February low and does not fall far below it, it will usually have to retest it later.
- The market became always in short around 8:00 PT, and the bulls never did enough to make the market reverse to always in long during 8:30 – 9:30, so the odds slightly favored a bear breakout.
- The bears got a climactic selloff that formed a wedge bottom at 11:45, which followed a strong buy the close rally into the close.
- Overall, the day was a trading range day that got a late bear breakout that led to a final flag and reversed back into the range. When you have a trading range lasting several hours on the open, there is a greater risk of a failed breakout and the market testing back into the range.
- The Emini broke below the February low today and reversed up late in the day.
- Tomorrow may gap up on the open. Although the buy signal bar did not close on its high, the context is good (failed breakout of the February low).
- Today is also a wedge bottom (1/24, 2/24, 5/2) which increases the odds of today being a possible low and the market reversing up from here.
- The bears want the opposite and hope today is just a breakout pullback short that will lead to lower prices.
See the weekly update for a discussion of the price action on the weekly chart and for what to expect going into next week.
Trading Room
Traders can see the end of the day bar-by-bar price action report by signing up for free at BrooksPriceAction.com. Al talks about the detailed S&P Emini futures price action real-time throughout the day in the BrooksPriceAction.com on trading room days. We offer a 2 day free trial.
Charts use Pacific Time
When times are mentioned, it is USA Pacific Time. The Emini day session charts begin at 6:30 am PT and end at 1:15 pm PT which is 15 minutes after the NYSE closes. You can read background information on the market reports on the Market Update page.