Weekend report co-author Andrew A.
Market Overview: Weekend Market Analysis
The SP500 Emini futures contract ended its 7 consecutive bull bars streak on monthly chart with an outside down bear bar in September. This will probably result in at least a couple months of sideways to down trading, but a pullback and then a new high is more likely than a bear trend on the monthly chart. There is a 50% chance that a 15% correction is underway, but there might be one more brief new high first.
The EURUSD Forex formed an outside down bear candlestick in September. Furthermore, it closed below November 2020 low, which was the bottom of the yearlong trading range. The bears want a 700-pip measured move down. However, it is more likely that the breakout will fail around the March high, which was the breakout point of the summer rally and around a 50% retracement.
EURUSD Forex market
The EURUSD monthly chart
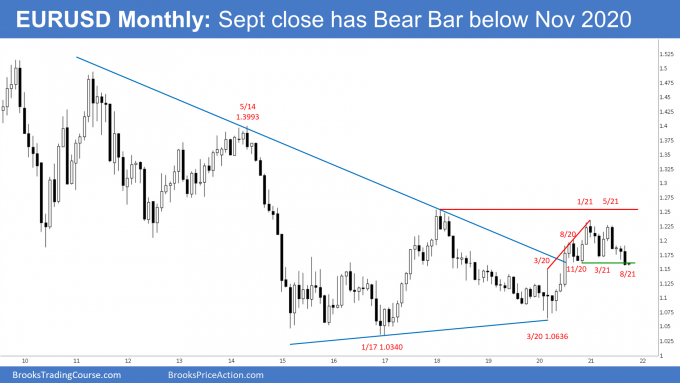
- October’s candlestick currently is a small inside bar, after September formed an outside down bar.
- It closed below the November 2020 low, which is the bottom of a yearlong trading range.
- Because EURUSD closed near the lows, odds favor the EURUSD to trade at least slightly lower in October.
- The bears want a 700-pip measured move lower. They will need October to be a strong bear follow-through to convince traders that the yearlong trading range has ended and that the EURUSD has evolved into a bear trend.
- The bar after an outside bar usually has a lot of overlap with the outside bar. It often is an inside bar, which creates an ioi Breakout Mode pattern.
- The selloff is strong enough for traders to expect it to go at least a little lower.
- The March 2020 high as the breakout point for the summer rally. It is at the 1.15 Big Round Number and a 50% retracement. There should be buyers there.
- Since most trading range breakouts fail, this selloff will probably be simply a test of that March 2020 high.
- Traders should expect at least a 2- to 3-month bounce from around the March 2020 high.
The EURUSD weekly chart
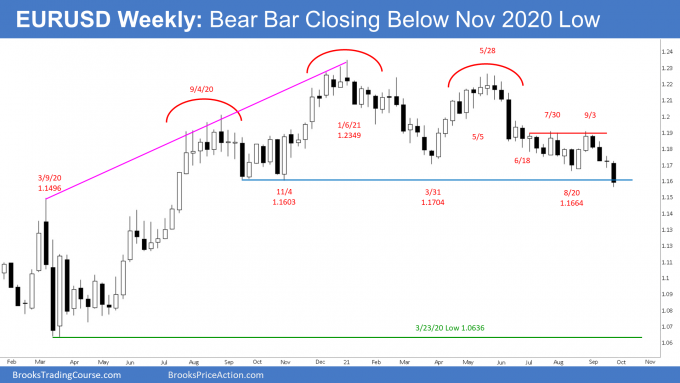
- This week’s candlestick on the weekly EURUSD Forex chart was a bear bar closing near the low.
- The bears want a resumption of the May to August bear trend and a 700-pip measured move down, based on the height of the yearlong trading range. They want next week to be a follow-through bear bar preferably closing near the low.
- That would increase the odds of a successful breakout.
- Since most breakouts fail, it is more likely that this selloff will end around the March 2020 high than continue down to test the March 2020 low.
- The bulls are hoping that this week’s sharp sell-off was simply a sell vacuum test of the November 2020’s low, and the current leg down since May is a bear leg in a trading range.
- If next week closes as a bull bar, the odds of a failed breakout increases.
- A reversal up from here would be a failed breakout below a trading range. There would also be a wedge bull flag with the March and August lows.
- However, if the bears manage to get consecutive big bear bars closing near the lows, the odds of a successful breakout and a measured move lower would increase. Traders would then conclude that the yearlong trading range has ended and that the EURUSD has evolved into a bear trend.
The EURUSD daily chart
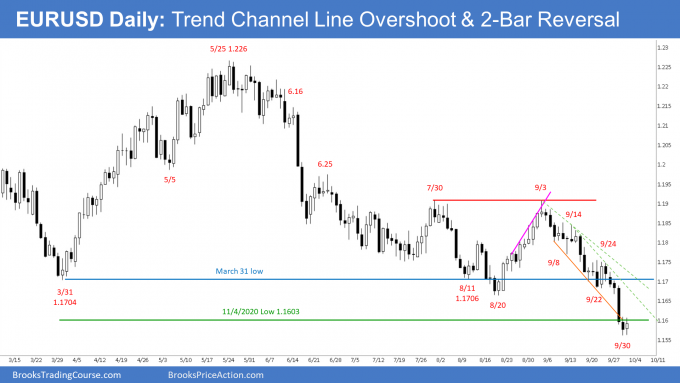
- The EURUSD Forex daily candlestick chart formed a big bear bar closing on its low on Wednesday. That was a strong breakout below the March/August double bottom.
- Thursday was the follow-through bar. Since it had a bear body, it makes at least a small 2nd leg sideways to down likely.
- The bears want a 700-pip measured move down based on the height of the yearlong trading range.
- The spike down this week overshot the bear trend channel line drawn across September 8 and September 22 lows.
- While Friday was a bull day, the body was small and the tail on top was prominent. That is not enough to make traders think that it will be the start of a bull trend. More likely a reversal up will be minor, even if it lasts a couple weeks.
- If the bulls get a bounce, the 1st targets are the EMA and the top of the most recent sell climax, which is Wednesday’s high.
- However, if the bears get consecutive big bear bars closing on their lows next week, the odds of a successful breakout increases. Traders will conclude that the yearlong trading range has ended and that the 6-month bear trend is intact.
S&P500 Emini futures
The Monthly Emini chart
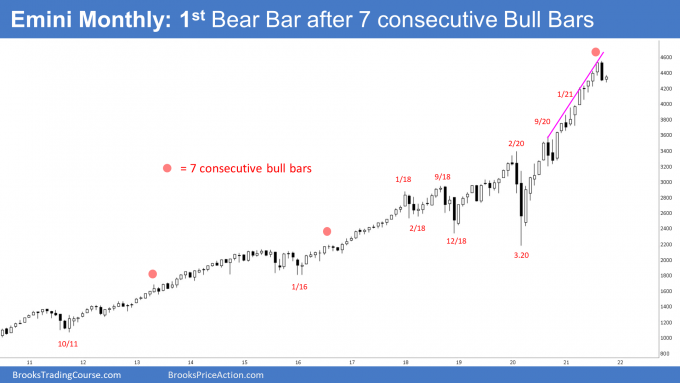
- September’s candlestick on the monthly Emini chart was a bear outside down bar closing near its low and below the September low. This is bearish, but the bull trend is strong. Traders will buy the 1st 2- to 3-month pullback
- September ended the 7-month streak of bull bars.
- Al has been saying that there has never been a streak of 8 consecutive bull bars in the 25-year history of the Emini, and that either September or October would be a bear bar.
- Furthermore, he has been saying that a bear bar should lead to 2 to 3 months of sideways to down trading. You can see that this is what happened with most other bear bars in prior buy climaxes.
- The bulls will try to create a credible High 1 buy signal bar in October. But even if they do, it will probably lead to a lower high and then a 2nd leg sideways to down.
- If the bulls are able to get a new high before the end of the year, it will probably be brief. An extreme buy climax like this typically results in at least 2 to 3 months of sideways to down trading.
- The bar after an outside bar often has a lot of overlap with the outside bar.
- It is still early in the month and the monthly candlestick will look different by the close of the month.
- At the moment, traders should expect sideways to down trading for a couple more months.
The Weekly S&P500 Emini futures chart
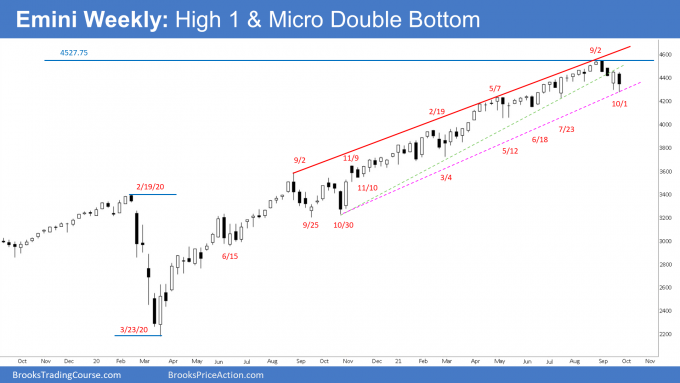
- The weekly Emini candlestick was a bear bar this week.
- It broke below last week’s low, but closed just below the middle of the bar. The bears were not as strong as they could have been.
- The Emini has been in a Small Pullback Bull Trend for more than 60 bars, which is unusual, and therefore unsustainable and climactic.
- Traders will conclude that the Small Pullback Bull Trend has ended once there is a pullback that is at least 50% bigger than the biggest pullback in the bull trend.
- The biggest pullback so far was the 10% selloff in September 2020. A bigger pullback typically means 15 to 20%, and that is why Al has been saying that traders should expect at least 15% correction to begin before the Emini goes much above the September high.
- There is a 50% chance that September 2 will remain the high for the rest of 2021.
- Since there is a 50% chance that the September 2 high will be the high of the year, there is a 50% chance that a 15% correction is underway.
- A 50% chance of September 2 being the high of the year means a 50% chance there will be a new high.
- The bulls know that most reversal attempts in a strong bull trend are minor. That means they become either bull flags or the start of a trading range.
- Since this rally is so extreme, a trading range for 10 or more bars is likely to begin soon. It probably has begun.
- That is true even if there is a new all-time high in the next couple months. Traders should not expect a resumption of the bull trend until at least December.
The Daily S&P500 Emini futures chart
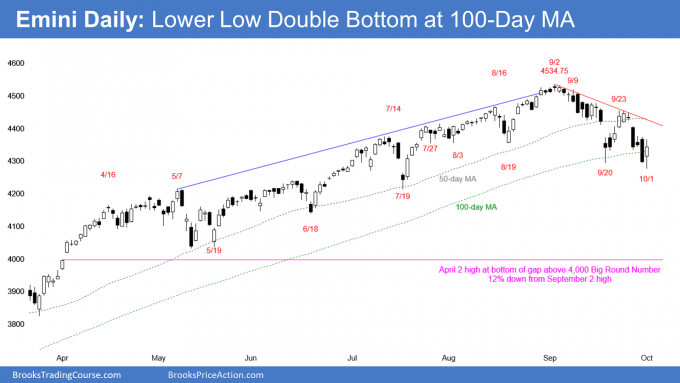
- Friday had a big bull body after breaking below the September 20th low.
- The bulls hope this 2nd reversal up from the 100-day MA will result in a resumption of the bull trend. They see this as a lower low double bottom with the September 20 low.
- However, Friday had a big tail on top and the September 23 high is still a credible lower high major trend reversal. It is also the right shoulder of a head and shoulders top.
- Traders are deciding if the 100-day MA support is more important than the 50-day MA resistance.
- It is common for a market to enter a trading range once it has a big reversal down from a buy climax. Big up and big down create big confusion. That typically results in a trading range.
- The daily chart has been sideways since July. Traders are deciding if the September selloff is just a bear leg in the trading range or the start of a bear trend.
- A bear trend has a series of lower highs and lows. The bears need to do more before traders will believe that the Emini is in a bear trend.
- When things are unclear, the probability is usually about 50% for the bulls and bears. That is the case now with the daily chart.
- Traders need to see a strong break below the Friday’s low or above the September 23 lower high before believing that the trading range is converting into a trend.
Trading Room
Traders can see the end of the day bar-by-bar price action report by signing up for free at BrooksPriceAction.com. I talk about the detailed Emini price action real-time throughout the day in the BrooksPriceAction.com trading room. We offer a 2 day free trial.
Weekly Reports Archive
You can access all weekly reports on the Market Analysis page.
This is not Al Brooks writing? the first leg in a trading interval is the channel the second leg is the leg that goes back and typically tests back to where the channel started. The market is still in a trading interval in this second leg.
Best Regards
Kent
The EURO has been having nested patterns on its daily and weekly charts.
For example, on the daily chart we had an ii that broke to the downside, which was a small trading range within a large trading range that is part of an even larger trading range.
And on the weekly chart, we have nested double tops. The 7/30 – 9/3 DT BF within a larger DT (1/6/21 – 5/28/21).
When we have nested patterns within a 50/50 market, how much is the probability shifted as a result of those nested patterns? Can the presence of nested patterns shift the probability to 60/40 or is it more like 55/45? Or is it difficult to say?
Thanks for the report, regarding the daily chart. Is it right to assume September 20th is the first leg in a wedge bottom, October 1st is the 2nd thus a 3rd one is expected down the road to complete this?
There is already a wedge with August 19/September 20/October 1. If there is a bounce and a new low, which I think is likely, a reversal up from below October 1 would create a wedge bottom.
Since a 15% correction is likely either now or after a brief new high, I am suspicious of rallies for the time being. I think a lot of computers will sell them, which would result in a series of lower highs and failed bottoms. That is a bear channel.