Monthly S&P500 Emini candle chart: Overbought with an ioi sell signal bar
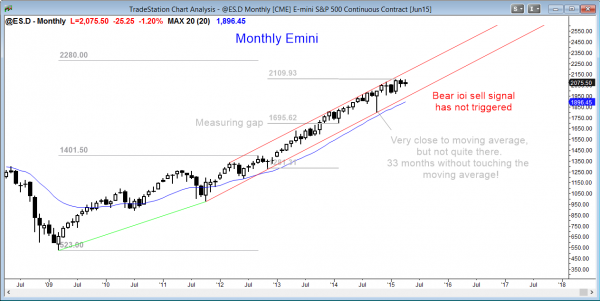
The monthly Emini candle chart is in a strong bull trend, but it is climactic. If the ioi candlestick pattern remains as it is now, it will be a sell signal for next month.
The monthly S&P500 Emini candle chart continues in a strong bull trend, but this is the 34th month without touching the moving average. This is an extreme buy climax and there is about an 80% chance of it touching the moving average at some point this year. However, there have been many brief attempts at a reversal over the past year and all have failed. This is consistent with my 80% rule…80% of trend reversal attempts become bull flags. One eventually will work. If the current candlestick closes on its low and the month remains inside of March, this would be an ioi sell candlestick pattern.
Weekly S&P500 Emini candle chart: Tight trading range and possible final bull flag
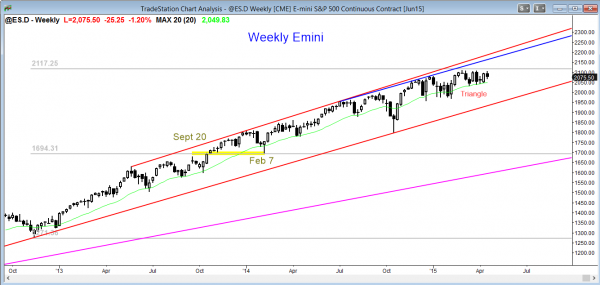
The weekly Emini candle chart is in a tight trading range just above the moving average and below the all-time high. This is a breakout mode pattern. If there is a bull breakout, it will probably fail, and the trading range will then be the final bull flag.
The weekly S&P500 Emini candle chart, like the monthly chart, is still in a strong bull trend. Each bar that gets added to the tight trading range lowers the probability of the bull breakout. At the moment, there is a 50-50 chance that the breakout will be up or down. If the breakout is to the upside, a tight trading range late in a bull trend like this usually becomes the final bull flag before a TBTL (Ten Bar, Two Leg) correction. The pullback could last longer because there is also a buy climax on the monthly chart, and it, too, could have a TBTL correction. This would be about a year of sideways to down trading.
Daily S&P500 Emini candle chart: Triangle at the all-time high
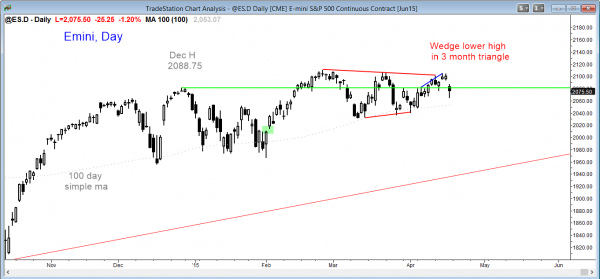
The daily Emini S&P500 Emini candle chart is in a triangle. It turned down this week from a small wedge lower high.
The daily S&P500 Emini candle chart has been in a broad bull channel for several years, and in a trading range for many months. It is at the top of that range. The chart is much less bullish and much more neutral than the monthly chart. However, traders learning how to trade the market need to know that until there is a breakout, there is no breakout.
The high probability trading strategy is to wait for the breakout in either direction and then assess its strength. If it is strong, look to trade in the direction of the breakout, especially if there is a downside breakout. Remember, the odds favor a correction this year that will last many months, and any upside breakout will probably be limited.
If there is an upside breakout, it will probably come with a divergence for traders relying on technical analysis, but I won’t bother to check because I will look for the breakout to fail and reverse down no matter what any indicators shows. Traders trading online will be ready for the breakout and look for a swing trade.
When the bear breakout finally comes, it may happen very fast with have very big bars and swing for day traders. Traders have to be prepared to trade smaller than usual (always trade the “I don’t care” size), if that is the case.
Weekly EURUSD Forex candlestick chart: Double bottom, but minor reversal
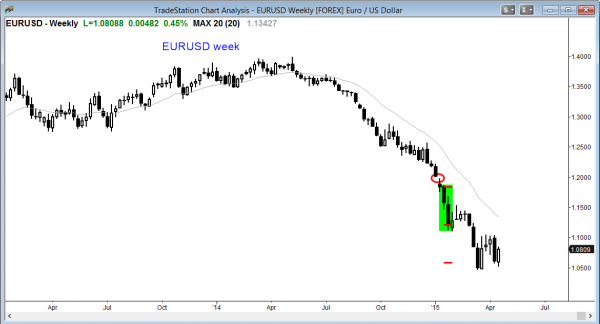
The weekly EURUSD Forex chart is oversold and has been going sideways for 6 weeks. A trading range and bear flag are more likely than a trend reversal.
The dollar is overbought and it has been correcting sideways for a couple of months against all currencies. However, the bear trend channel on the EURUSD weekly chart is very tight. This means that any reversal up will probably become a bull leg in a trading range (bear flag) than a bull trend.
Because of the consecutive sell climaxes, a rally could last for several months, but the odds then favor a test down. There is a small double bottom, and if the bulls are successful in getting a breakout above the neckline, the rally could reach the 1.1500 area. This would be around the moving average, which the Forex market has not tested since July 2014. This would be a 20 gap bar sell setup (even though it is more like 40 bars).
A bull trend is unlikely until after a major trend reversal develops, and that would take at least 10 – 20 more bars (weeks). Until then, the Forex trading strategy is to be quick to take profits on longs, and then look to swing trade shorts once a bear flag has a reliable shape and is at resistance, like at the moving average.
Traders can see the end of the day bar-by-bar price action report by signing up for free at BrooksPriceAction.com. I talk about the detailed Emini price action real-time throughout the day in the BrooksPriceAction.com trading room, and a 2 day free trial is available.
When I mention time, it is USA Pacific Standard Time (the Emini day session opens at 6:30 am PST, and closes at 1:15 pm PST). You can read background information on the intraday market reports on the Intraday Market Update page.


Hey Al,
in the first paragraph you said that every trend reversal attempt has only a 20% chance of working. Does this refer to MTRs as well? Because I thougt MTRs had a 40% chance of working and pullbacks in general only do have a 60% chance of having FT in the direction of the BO. What are the setups having an 80% chance of trend resumption?
Thanks in advance,
Paul
Your point is good, and the answer is that it does not. MTRs have a 40% chance of success. An MTR forms in a broad channel. A bull trend that is in a breakout or tight channel has only a 20% chance of reversing. 80% of reversal attempts become bull flags and are followed by trend resumption.