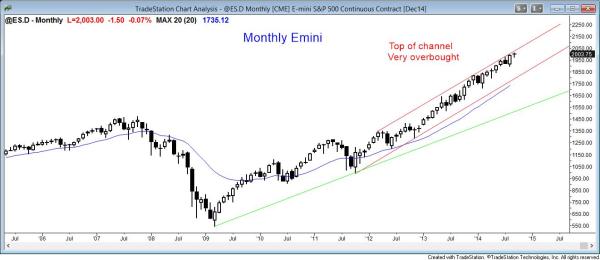
The monthly S&P500 Emini candle chart is in a strong bull trend, but overbought

The S&P500 Emini monthly chart is in a strong bull trend, but it is overbought.
Although there is a bull breakout on the weekly candle chart, the monthly chart is very overbought. It can continue to be overbought for a long time, but it has only been this overbought 3 times in the past 20 years. Each prior time was followed by a reversal of 20% or more. So far, the candle on the monthly chart is a doji, which represents indecision, and it is occurring at an all-time high.
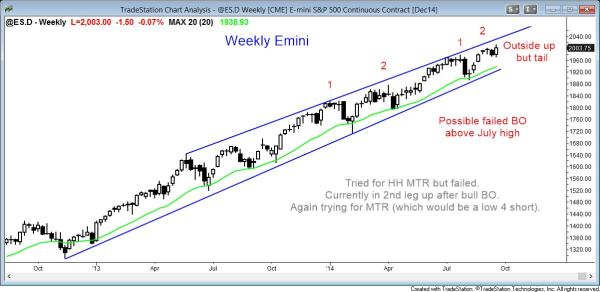
Bull breakout on the weekly candle chart

The S&P500 Emini weekly chart is in a strong bull trend, and formed an outside up candle this wee. This is bullish, but the Emini is near the top of the channel.
The weekly Emini candle closed above the highs of the last two weeks and at an all-time high. That close created a gap above those highs. The bulls want the gap to be a measuring gap that will be followed by a strong leg up. The bears want the Emini to trade below those highs next week, turning the gap into a possible exhaustion gap. Since the Emini is close to the top of the channel and most channel breakout attempts fail, the odds favor a move down to the bottom of the weekly channel at some point within a month or so.
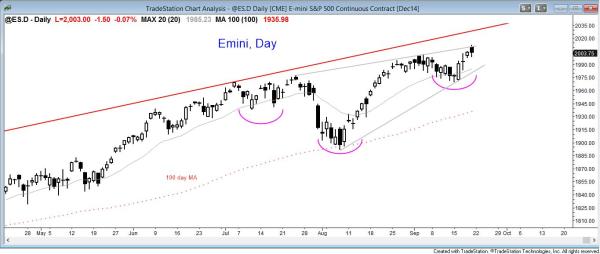
The daily S&P500 Emini candle chart is at an all-time high, but it is struggling to find enough buyers at this level.

The S&P500 Emini daily chart is in both a head and shoulders bottom bull flag and a wedge top.
The Emini daily chart is at an all-time high. However, it continues to fail to resume up. So far, there are not enough buyers around 2,000 to create a strong bull breakout. If the bulls continue to fail, the Emini will fall to lower levels as it searches for buyers.
The bulls see the past 3 months as a head and shoulders bottom bull flag and they expect a strong bull breakout above the top of the channel. Since 70% of bull breakout above bull channels fail, this one probably will, too.
The bears see the Emini as being in a 3 month wedge top. They are looking for a reversal down to the bottom of the wedge, which is the August low, around 1900.
Traders can see the end of the day bar-by-bar price action report by signing up for free at BrooksPriceAction.com. I talk about the detailed Emini price action real-time throughout the day in the BrooksPriceAction.com trading room, and a 2 day free trial is available.
When I mention time, it is USA Pacific Standard Time (the Emini day session opens at 6:30 am PST, and closes at 1:15 pm PST). You can read background information on the intraday market reports on the Intraday Market Update page.