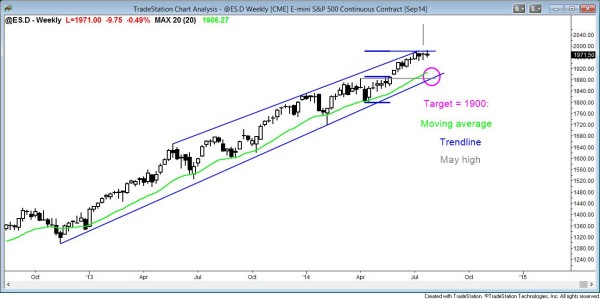
The Emini weekly chart is at the top of the channel and it is forming a possible buy climax in an overbought bull trend.
Three weeks ago, the weekly Emini had a small breakout above the top of the channel, and this week, it briefly broke above a measured move target (for the projection, I used the May 23 high, which corresponds to the bottom of a May 27 measuring gap on the daily chart).
Two weeks ago, the Emini also had the first breakout below a 10 bar bull microchannel. This is usually followed by a brief rally, which has occurred over the past two weeks, and then a TBTL (Ten Bars, Two Legs) pullback. All of these factors point to a pullback. However, the trend is so strong that a trend reversal is not likely at the moment. Initial targets are the bottom of the channel, the breakout point above the March to May trading range (the horizontal gray line), and the moving average, all of which are around 1900.

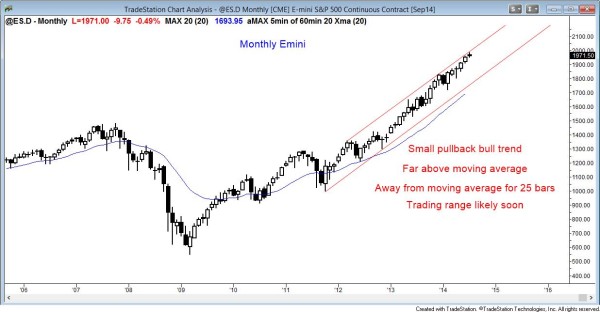
The Emini monthly chart is in a strong bull trend, but overbought.
The current bar on the monthly chart will close on Thursday, the last day of the month. It is currently a small doji, but it might become a bear reversal bar because the S&P500 is overbought and at resistance on the weekly chart. Less likely, it will be a big bull trend bar. The monthly Emini and stock market are in small pullback bull trends. The Emini has not touched the moving average in about 25 bars, which is unusual, and it is far above the moving average. This is a sign of strength, but when extreme strength occurs late in a trend, it can be a sign of exhaustion.
The first pullback in a strong bull trend is usually limited when the stock market is this strong, and the best the bears can reasonably expect over the next many months is a trading range. Bears will begin to bet on the evolution into a trading range. They will begin buy puts on strong intraday rallies, and put spreads at all other times. The bulls will continue to buy calls and call spreads on bear trend days and on a pullback to near the bottom of the channel. Since a trading range is likely, most traders will switch to taking quick profits when they have them, and some will consider scaling in. The bulls will buy more (calls, call spreads, stocks, or futures) as the market falls near the bottom of the channel, and the bears will sell more (or buy more puts or put spreads) as it rallies. Since the Emini is at the top of the channel, the bears have a slightly higher probability.
Traders can see the end of the day bar-by-bar price action report by signing up for free at BrooksPriceAction.com. I talk about the detailed Emini price action real-time throughout the day in the BrooksPriceAction.com trading room, and a 2 day free trial is available.
When I mention time, it is USA Pacific Standard Time (the Emini day session opens at 6:30 am PST, and closes at 1:15 pm PST). You can read background information on the intraday market reports on the Intraday Market Update page.