Market Overview
The Emini began to pull back this week after a parabolic wedge buy climax on the daily chart. It is at the resistance of the October-November-December triple top and 2800. The streak of 9 consecutive bull bars on the weekly chart ended as well. Traders should expect 2 – 3 weeks of sideways to down trading, even if there is a small breakout above this week’s high first.
The crude oil futures daily chart turned down on Friday after a parabolic wedge rally. It will probably work down to around $50 over the next few weeks.
The EURUSD daily Forex chart is in the middle of its 4 month trading range. Traders continue to look for reversals every 2 – 3 weeks. They are waiting for news on Brexit before they will bet on a breakout beyond the range.
Crude oil Futures market:
Parabolic wedge buy climax might lead to pullback to 50
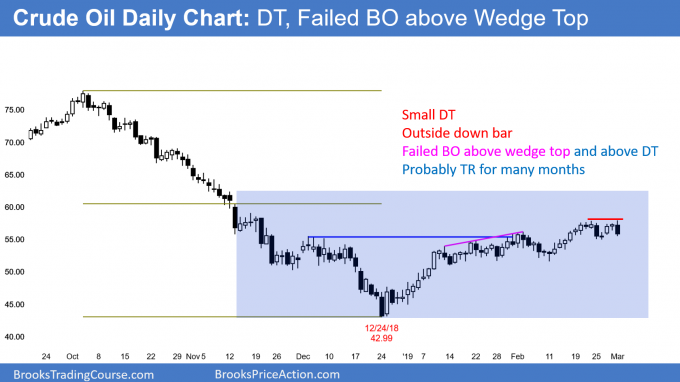
The crude oil futures chart had a strong rally up from the December low. It has been in a tight bull channel for 7 weeks. Since the channel has had 3 pushes up, it is a parabolic wedge buy climax.
A buy climax usually means that the bulls are exhausted and will begin to take profits. Typically, the profit taking will last at least 10 bars. In addition, the selloff usually has at least 2 legs. Friday’s outside down move might be the start of the profit taking.
If so, reasonable targets are the start of the channel (which is the January 14 low, a 50% pullback (which is around $50), and a Big Round Number (like 50). Therefore, the odds are that either crude oil has begun a pullback to around $50, or there will be sellers not far above this week’s high, and then there will be a pullback.
The upside from here is probably minimal without a pullback first. Even then, the chart will probably be in a $20 trading range for many months. The top of the range will probably be between 60 and 65.
EURUSD weekly Forex chart:
Trading range, waiting for Brexit news
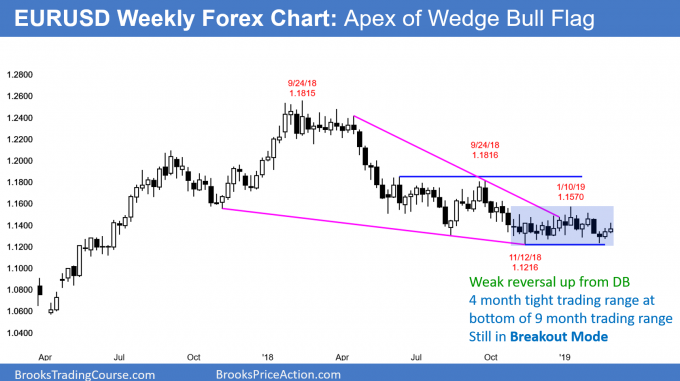
The EURUSD weekly Forex chart formed a 2nd consecutive bull bar this week. However, the bars were small and they are in a 4 month trading range. There has been a reversal every 2 – 3 weeks. Therefore, this week will probably not be bullish. More likely it will be sideways to down.
The daily chart has rallied for 3 weeks in a wedge bull channel. A wedge rally is a bear flag. A bear break below the bull trend line is more likely than a breakout above the top of the wedge.
But the dominant feature is the 4 month trading range. Therefore, the direction of the breakout of the 3 week wedge is not particularly important. Much more important is the reality that every strong move up or down has reversed for 4 months. Consequently, traders do not expect a big move either way. They will continue to bet on reversals.
Trading ranges do not last forever
Every trading range for over 2 years broke out after about a couple of months. Since this one has lasted 4 months, it will break out soon. Traders are waiting for news about Brexit.
No matter what the news is, there is a 50% chance that the breakout will be up and a 50% chance that it will be down. Furthermore, there is a 50% chance that the 1st breakout will fail and reverse.
Traders want to see a breakout up or down that has 2 strong trend bars and consecutive closes beyond the range. Once they see that, they know that the odds will favor about 300 – 400 pip measured move, and a trend with at least 2 legs.
Monthly S&P500 Emini futures chart:
March follows 2 consecutive strongly bullish months
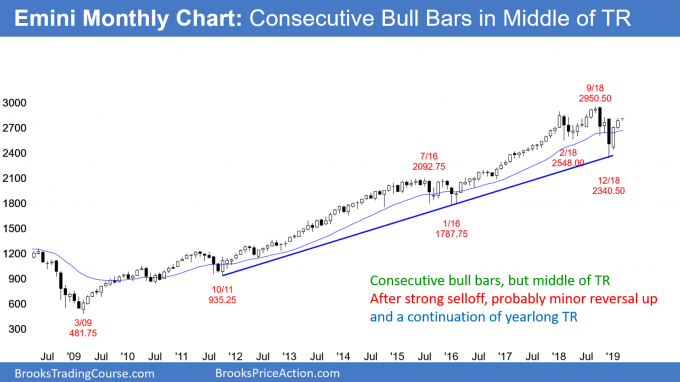
The monthly S&P500 Emini futures chart rallied unusually strongly in January and February. It reversed up from an 8 year bull trend line after a December sell climax.
The rally is testing the top of the December huge bear bar. Despite the strong rally, the chart is still only in the middle of a yearlong trading range. In addition, a Big Down, Big Up move typically creates Big Confusion. Since confusion is a hallmark of a trading range, the trading range is likely to continue. This is true even if the Emini breaks above the all-time high.
In addition to confusing traders, trading ranges also disappoint them. The bears were disappointed by the rallies after the 2 big selloffs in February and December last year. In addition, the bulls were disappointed by the reversals down from strong rallies in January and September.
After 2 strong months up, the bulls are hopeful that the rally will continue up to a new high. However, what would disappoint them? Either a sideways bar or a bear bar on the monthly chart in March or April. Since the chart is still in a trading range, that is what is likely.
Weekly S&P500 Emini futures chart:
End of streak of 9 weekly Emini bull bars
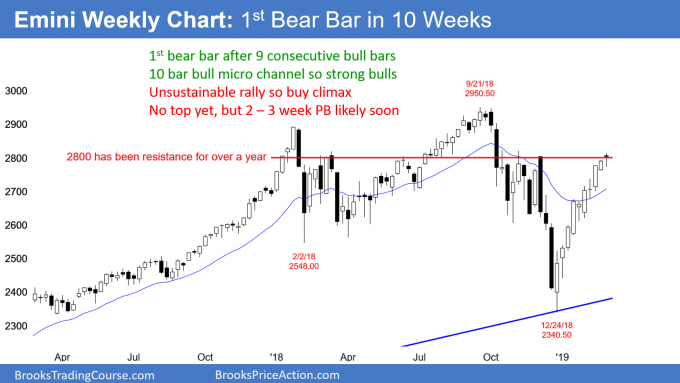
The week S&P500 Emini futures chart finally had a bear body this week. The body was small and therefore the bar was just a doji bar. However, the close was below the open.
Prior to this week, the weekly chart had 9 consecutive bull trend bars. I found only one instance of a longer streak in the 20+ year history of the Emini. In every prior streak of 8 or more bull bars, once there was a bear bar, the chart went sideways to down for 3 or more weeks. Consequently, that is what is likely now.
Not only have there been 9 consecutive bull bars, every low has been above the low of the prior week. This is a 10 bar bull micro channel. It tells traders that the bulls have been so eager to buy that they are not waiting for a pullback below the prior week’s low.
When bulls are this aggressive, they typically are happy to get a chance to finally buy below the low of the prior week. As a result, the 1st pullback usually only lasts 1 – 3 weeks.
Furthermore, it is typically not deep. Consequently, the Emini will probably pull back 50 – 100 points in early March. This will attract buyers. The rally will then likely once again test the December high and above 2800.
Bulls will buy even a strong selloff
The year will not continue up in a tight bull channel. There will be at least one strong reversal down at some point. It will probably last at least a couple months.
But, after a strong reversal up from the monthly bull trend line, the bulls will buy the pullback. This is true even if it is strong and reverses more than 50% of the rally.
Whenever there is an exceptionally strong trend reversal, the odds are that there will be at least a 2nd leg sideways to up. This means that the pullback will lead to a rally that will test the top of the 1st leg up.
That is the minimum goal. With the rally as strong as it has been and with the monthly chart in a bull flag, the Emini will probably test the all-time high at some point in 2019.
Daily S&P500 Emini futures chart:
Parabolic wedge buy climax at 2800 resistance
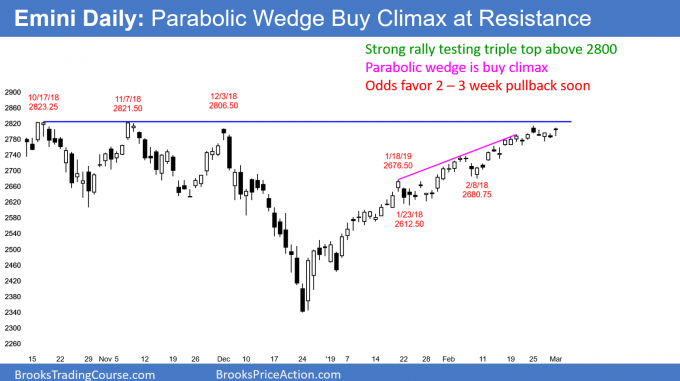
The daily S&P500 Emini futures chart has been in a tight bull channel since the January 12 low. This followed a strong reversal up (a bull spike) from the December low.
The 6 week tight bull channel has had at least 3 pushes up in it. A tight bull channel with 3 pushes up is a parabolic wedge. That is a type of buy climax. The stop for the bulls is far below. Many bulls will begin to reduce their risk by taking some profits.
This past week had a good sell signal bar on Monday. It reversed down from above 2800 and the December high. Friday tested Monday’s high. This is a small double top and a reasonable candidate for the start of a 2 – 3 week, 50 – 100 point pullback.
What happens if next week breaks above this week’s high? The daily chart is still at major resistance and it is in a buy climax. There will therefore probably be sellers not far above. A 2 – 3 week pullback is probably underway, or it will begin within a couple of weeks.
Trading ranges sometimes have several highs at the top
There is an interesting behavior that is common in trading ranges. If there are 2 or more resistance level that are close to one another, a rally often goes above some of the prior highs, but then fails to go above the highest high. This might be happening now.
The Emini went above the December high, but it has not yet gone above the October or November highs, which are just a little higher. The daily chart is in a yearlong trading range. There is therefore an increased chance of the Emini turning down from here for a few weeks.
The importance of 2800
The bulls will probably begin to take some profits now that the Emini is testing major resistance. The bulls have been trying to break strongly above 2800 for over a year. Despite July reaching 2950, the bulls could not hold above 2800. The rally collapsed to far below 2800.
The bulls failed in October, November, and December to get above 2800. They failed and formed a triple top. The stock market crashed in December down to the monthly bull trend line.
However, this bull trend reversal has been exceptionally strong. As a result, the bulls are very eager to buy. Even if the profit taking lasts several months and retraces half of the rally, the odds are that there will be at least one more leg up.
Why do traders buy in a buy climax?
Traders are willing to buy in a buy climax because they know the chance of a bear trend near-term is small. They believe they will make money even if they buy at what turns out to be the high of this 1st leg up.
Either the current rally will continue up far enough for them to make money, or there will be a pullback and then a test back up to this level. That would create a trading range.
In the trading range scenario, they will look for any selloff to reverse back up from a higher low. Many will therefore buy more as the selloff continues or on the reversal up. They then can exit their original buy around breakeven, and they will have a profit on their lower buy.
Trading Room
Traders can see the end of the day bar-by-bar price action report by signing up for free at BrooksPriceAction.com. I talk about the detailed Emini price action real-time throughout the day in the BrooksPriceAction.com trading room. We offer a 2 day free trial.
Charts use Pacific Standard Time
When I mention time, it is USA Pacific Standard Time (the Emini day session opens at 6:30 am PST, and closes at 1:15 pm PST). You can read background information on the intraday market reports on the Intraday Market Update page.
Al, regarding buy in climax, expecting sell off to be only PB. Isn`t the PB so obvious that it would make more sense to wait and buy PB instead of loosing on 1st entry at obvious resistance?
thx
Hi Jiri,
Al’s final section above makes it very clear on this. So just a matter of personality. Sure, if you feel more comfortable waiting for the pullback, especially if you have a small account or low appetite for scaling in, then do so. Remember that the pullback is not ‘so obvious’, nothing is certain, and may not happen – in which case those strong bulls buying climax will not need to scale in, and can reap the benefits of further movement up.
Wouldn`t that go against probability and basic`s of Al teaching that most BO fails? Making the trade high risk and low prob?
Only if your trading personality deems it so. Most breakouts fail, yes, but not all of course. Aggressive traders with deep pockets are trading on every bar! A high risk trade with low probability can still have a high reward in this case. Like traders in a Buy The Close trend not worrying about pullbacks until serious selling pressure appears.
PS. Post comments are normally only open for 7 days, so this will be final comment in thread. Wanted to post reply.