Trading Update: Thursday March 31, 2022
Emini pre-open market analysis
Emini daily chart
- Today is the final trading day of the month, so the bulls want a strong close, and the bears want to disappoint monthly chart traders as much as possible.
- The Emini got a bear close yesterday after four consecutive bull bars on the daily chart. The odds are the market will have to go sideways to relieve the exhaustion of the bulls.
- Yesterday also tested the February high. The bears hope that the market stalls around the February highs and makes traders question if Tuesday’s bull breakout above the February high will fail and lead to a selloff.
- Currently, the rally up is too tight, and the best the bears can get is a minor reversal and a trading range.
- While the odds favor more up, the overall context of the daily chart is a trading range, which means that the market may go sideways around this price level. If the market does go sideways for 10+ bars, the market could quickly get back to neutral.
- As unlikely as it looks, the bears may get back to the March 3 breakout point, sometime in April. This is because the market is in a trading range, and trading ranges ultimately disappoint traders.
- The market is also far away from the 20 period moving average in both distance and time. This increases the odds that the market will have to get closer to the moving average because traders are only willing to buy above the moving average for so long.
- At some point, there will not be enough buyers above the moving average, and the market will have to pullback.
- Overall, traders should expect a trading range and sideways trading on the daily chart over the new day or two as the market begins to stall.
Emini 5-minute chart and what to expect today
- Emini is down 6 points in the overnight Globex session.
- The Globex market was in a trading range, and traders should expect a continued trading range during the day session
- Traders should wait for a credible stop entry such as a wedge top/bottom, double top/bottom, or strong breakout with follow-through before buying.
- Since today is the final trading day of the month, traders should be aware that there is a greater chance the market may have a big move up or down late in the day.
- Today is the month’s last trading day, so that traders will pay close attention to support and resistance on the monthly chart. The most obvious magnet on the monthly chart is last month’s high which is 4577.5. Traders should pay attention to this price level as it may be an important magnet today.
Yesterday’s Emini setups
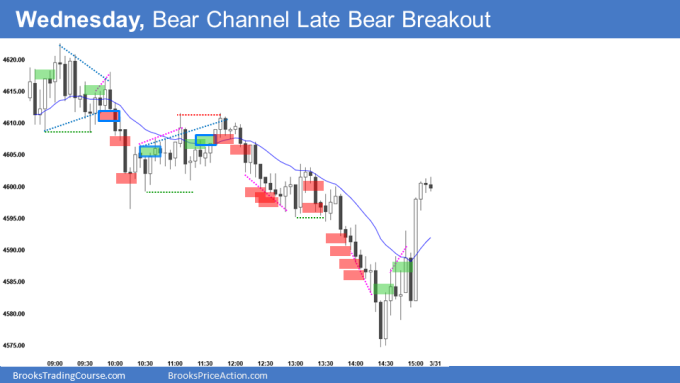
- Al Brooks on London PA Symposium and overseas break.

Emini charts created by Brad. Al will be back on April 11, 2022
EURUSD Forex market trading strategies
EURUSD Forex daily chart

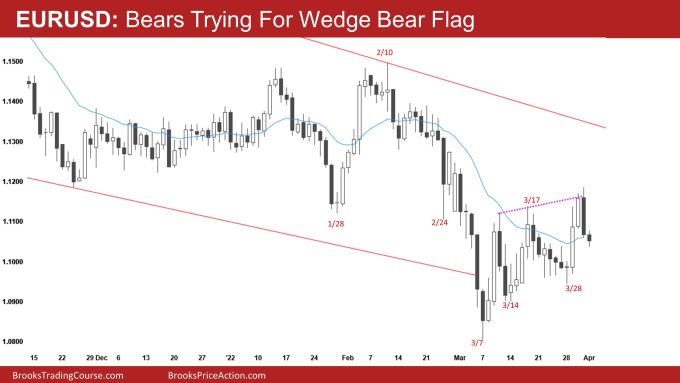
- The EURUSD has two strong consecutive bull bars breaking above the March high. They hope it will lead to a measured move up of the bull bars and the March bear flag, which would test the February highs.
- While the odds favor a second leg up, the bears have a bear bar closing on its low. If today is a big bear bar closing on its low, bulls may exit below due to the risk of a wedge top bear flag and a test of the March low.
- Bulls will try hard to prevent today from closing on its low. There are many trading hours left, so today’s bar can look very different when the day closes.
- Yesterday’s bull follow-through bar closed above January 28 Low, closing the gap that is good for the bulls and increases the odds of the 3-month trading range acting as a final flag leading to higher prices.
- Today is the final trading day of the month, so monthly support and resistance are important.
- Last month’s low is 1.1106, which is currently the exact price of the EURUSD. Traders should pay attention to this price level as the bulls want to close above it and the bears want to close below it.
Summary of today’s S&P Emini futures price action and what to expect tomorrow

Emini charts created by Brad. Al will be back on April 11, 2022
End of day summary
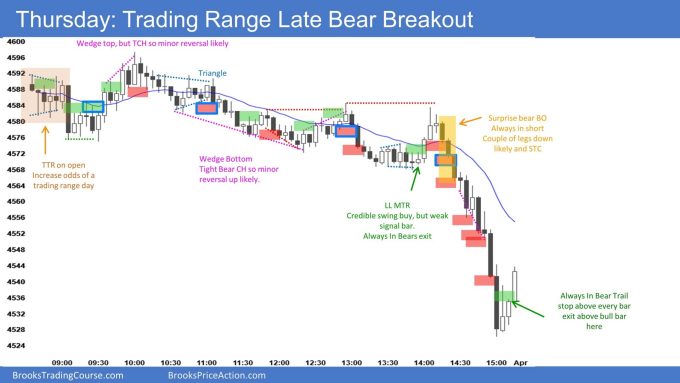
- The market entered a Trading Range early on the open. With the first 6 bars being sideways in a triangle, it was a sign that the market might be in a trading range for the entire day.
- The day went sideways up until the final hour of the day, when the market had a very strong breakout that doubled the range.
- As Al often says, days like today are challenging because they “lull” traders to sleep. He means it causes traders to expect the day to end as a trading range day, and in the final hour of the day, you have a big breakout that can easily be missed.
- There were signs that the market was in a bear trend since bar 18, but they are subtle. A trading range always has signs of a bear trend and a bull trend, which means the probability is closer to 50% for both directions.
- Today is an excellent reminder that a bear breakout can come at any point in the day and never be in denial when a strong breakout happens.
See the weekly update for a discussion of the price action on the weekly chart and for what to expect going into next week.
Trading Room
Traders can see the end of the day bar-by-bar price action report by signing up for free at BrooksPriceAction.com. I talk about the detailed S&P Emini futures price action real-time throughout the day in the BrooksPriceAction.com on trading room days. We offer a 2 day free trial.
Charts use Pacific Time
When I mention time, it is USA Pacific Time. The Emini day session charts begin at 6:30 am PT and end at 1:15 pm PT which is 15 minutes after the NYSE closes. You can read background information on the market reports on the Market Update page.
Hi, Brad, Is Bar65 a good signal bar? target is bar52 close or bar 54 high.
For bar 62,63,64 are all with significant tails, although it is a tight TR, but also a small wedge.
How to find a good signal bar in tight TR?
Thanks.
The market was in trading for the entire day, and there was a bear breakout at a bar 55 (11:00 AM Pacific Time). This breakout had follow-through. However, it was not closing far below the entire day’s range. While the odds favored a couple of legs down after bar 55, the market had three attempts to go down by bar 65 (11:55 Pacific Time).
Sometimes, it helps to put yourself in the bear’s perspective and pretend you are short on bars 55 -58. If you were short here, how many reversal attempts would you be willing to hold through before you give up on lower prices? By bar Bar 65 (11:55), many bears will exit shorts due to the probability of not being high enough to bet on a downside breakout.
Another Point:
When analyzing a breakout, always remember that you need a high probability for a breakout to have a profitable trader’s equation. The risk reward is bad, so the high probability makes up for the lousy risk-reward. The probability is often not greater than 60% or worse than 40% in a trading range. This means that bar 55-56 might have a 60% chance of lower prices, but by 58 11:20, that probability may only be slightly lower than 60%, making staying short a losing trader’s equation.
I am making that Breakouts within broad channels and trading ranges often have very brief moments of high probability before the probability goes back to neutral and possibly reverses. This is what happed around bar 65. The chance was too low for the bears to use a wide stop, so they had to tighten their visit to increase their risk-reward.
Regarding Tight Trading Range Signal Bars:
The challenge with a trading range is that it is a breakout mode situation, so the probability, in general, is close to 50%. This means that any bar has a 50% chance of getting an upside/downside breakout in theory, so the signal bar is less important.
Regarding your question about bar 65, the context matters more than the signal bar. The bears will only sell the reversal attempts during bars 62-66 for so long before they give up.
Hi Brad, I read your comments over and over, it makes great sense. thanks
Hi Brad, why was bar 30 not a good buy? Thanks
On Wednesday
Bar 30 is in a tight trading range just below the moving average, making the probability lower. It is an okay swing buy, but the bulls have already had two pushes up, so a breakout on bar 31 might lead to a wedge top, which is what happened.
Most bulls who were long would be disappointed on bar 31 and look to exit on the close or as bar 32 wend below bar 31. The open of bar 32 tells you many traders sold the close of bar 31 to exit longs and go short.
why did the odds favor TR on the 5 min chart today?
I believe due to the strong bull trend on the daily chart, the best the bears could get is sideways trading to slightly down. Any pullback will probably be profit taking by the bulls rather than shorting by the bears. As we’ve seen for the past few days.
Additionally, the past two days have had trading range price action and knowing that 80% of breakouts fail and that markets have inertia, today would have the probability of leading to the same kind of price action.
Until we received the breakout at the end of the day after bulls stepped aside waiting for lower prices to buy.
This is my take on it.
Jorden is spot on. The bulls are exhausted on the daily chart, so they will need at least a day or two of sideways price action to relieve the bulls.
While the odds favor more up, today was a big enough bear bar that it may have a small second leg down before the market reverses back up.
Today was also a reminder that the daily is in a trading range. Traders were expecting a pullback. However, today was big enough to make traders question how much higher the market would go.
Jorden and Brad – makes perfect sense. Thank you!
Thanks Brad, and others, for stepping in when Al is absent.