Market Overview: FTSE 100 Futures
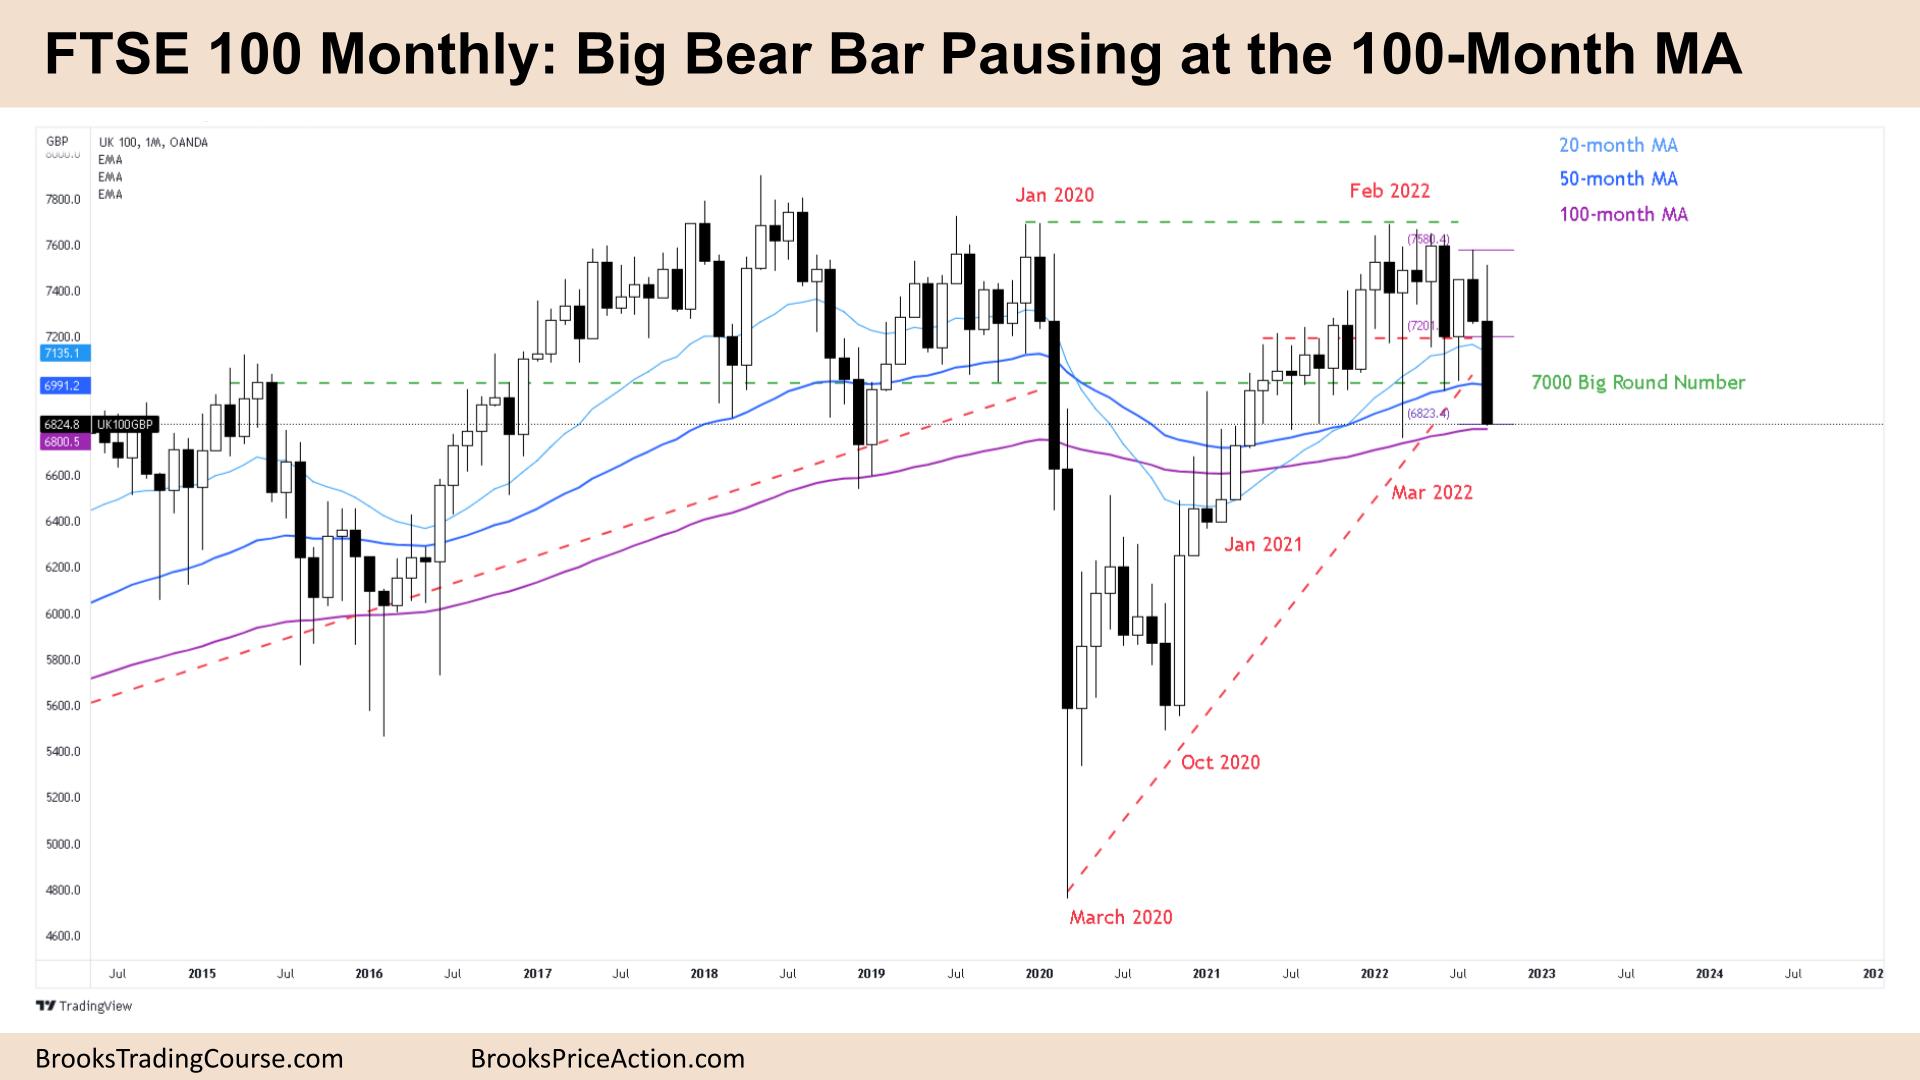
The FTSE futures market continued down last month with a big bear bar pause as traders expected after an August strong sell signal. The bulls want a moving average gap bar buy setup and the bears want another leg down. It’s a longer-term trendline break, so some traders will expect a test of the trendline before positioning for a longer-term move. Most traders should expect sideways to down trading next week.
FTSE 100 Futures
The Monthly FTSE chart

- The FTSE 100 futures was a big bear bar closing on its low last month so we might gap down on Monday.
- It is the second consecutive big bear bar closing on its low so we are always in short.
- We are pausing at the 100-month moving average (MA) which has been an area of interest for many years so we might go sideways here while traders decide.
- For the bulls it’s 2 legs sideways to down after a 2.5-year bull trend from the COVID lows.
- Traders expected a pullback so September could be a sell climax, a sell vacuum test of the lows where bulls step aside, knowing they can soon buy much lower.
- The bulls want a pause bar here and another buy signal like July. A second entry buy is a High 2 and a reasonable buy setup.
- The bulls want next month to close completely below the 20-month MA which would make a 20-bar moving average gap bar buy – a reasonable long entry in a bull trend.
- Traders have been paying above average for many months so a chance to buy at a discount will attract buyers. It will also be a magnet for bears to take profits.
- The bears see a strong second leg down after a trend line break and a lower low, possible major trend reversal.
- There are multiple tight trading ranges above so they wanted to break out and get a measured move down – they have been unable to close here since Jan 2021.
- The bears want either a big bull bar next month – too big for the bulls to risk to buy, or a small bull bar with a tail above – a bad buy signal.
- In the past 7 years on the chart, only 4 times have there been 3 monthly bear bars in a row, so even if next month trades lower, December should be a bull bar.
- It’s a trading range so stop entries have been rare on the monthly chart – last month being one of the few successful ones. More likely traders do the opposite – buy weakness and sell strength.
- It’s a sell signal, but at the bottom of a trading range, it is a low-probability sell. It’s also a big bar so the stop is far away so the risk is big. Bears want a bar like March 2020 and a collapse but are unlikely to get it at the bottom of a trading range.
- Bulls want a big reversal but after two consecutive big bear bars its a bad buy setup. It could form a more symmetrical inverse head and shoulders pattern – a cup and handle for a long-term buy – we will see over the next few months.
- Expect sideways to down next month as longer-term buyers start to consider entering the market.
The Weekly FTSE chart

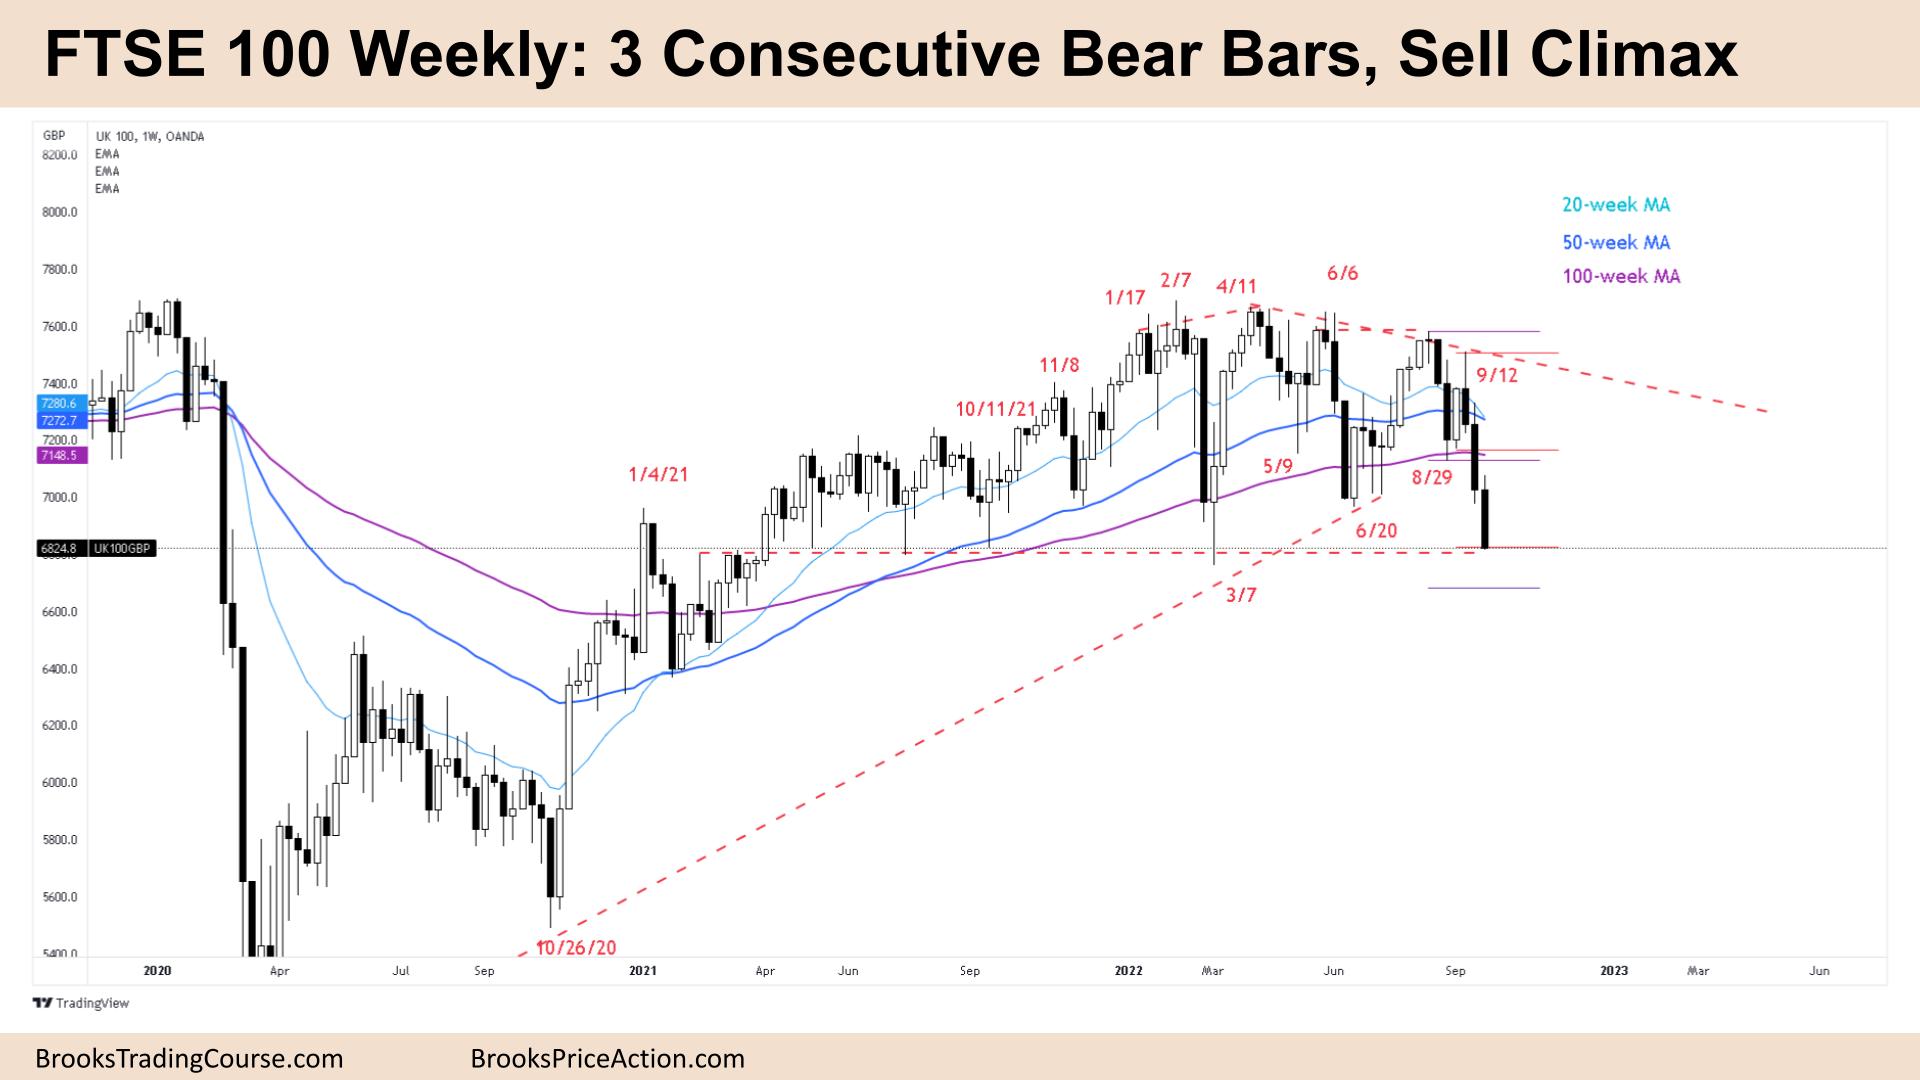
- The FTSE 100 futures was a big bear bar closing on its low last week so we might gap down on Monday.
- It is the third consecutive big bear bar closing on its low so we are always in short. It is also a sell climax and might attract profit taking.
- We closed at the bottom of an 18-month trading range so we might go sideways here while traders decide.
- The bulls see a breakout test of the trading range. The past 5 times we traded strongly into this area price bounced away so it is not as bearish as it seems.
- The bulls see a trading range, a second leg sideways to down after a tight bull channel and a lower low. They see a possible wedge bottom, but without a buy signal yet.
- The bulls want a reversal week next week to set up a High 1 buy signal. Although 3 bear bars is a bad buy setup so a second entry has a higher probability.
- The bears hit their measured move target from the lower high last week and are now looking to hit the higher-high double-top measured move target.
- For the bears it’s always in long, but the stop is far away and a big risk so it might attract profit taking. Three consecutive bear bars are strong enough that traders will expect a second leg.
- But look left, June ended like September and it was the start of a 9-week bull channel. The bulls will probably need a double bottom on this timeframe before it does something similar.
- Bears want another leg down, which could form a parabolic wedge but for now, it looks like sideways to down next month as traders decide.
Market analysis reports archive
You can access all weekend reports on the Market Analysis page.