Market Overview: FTSE 100 Futures
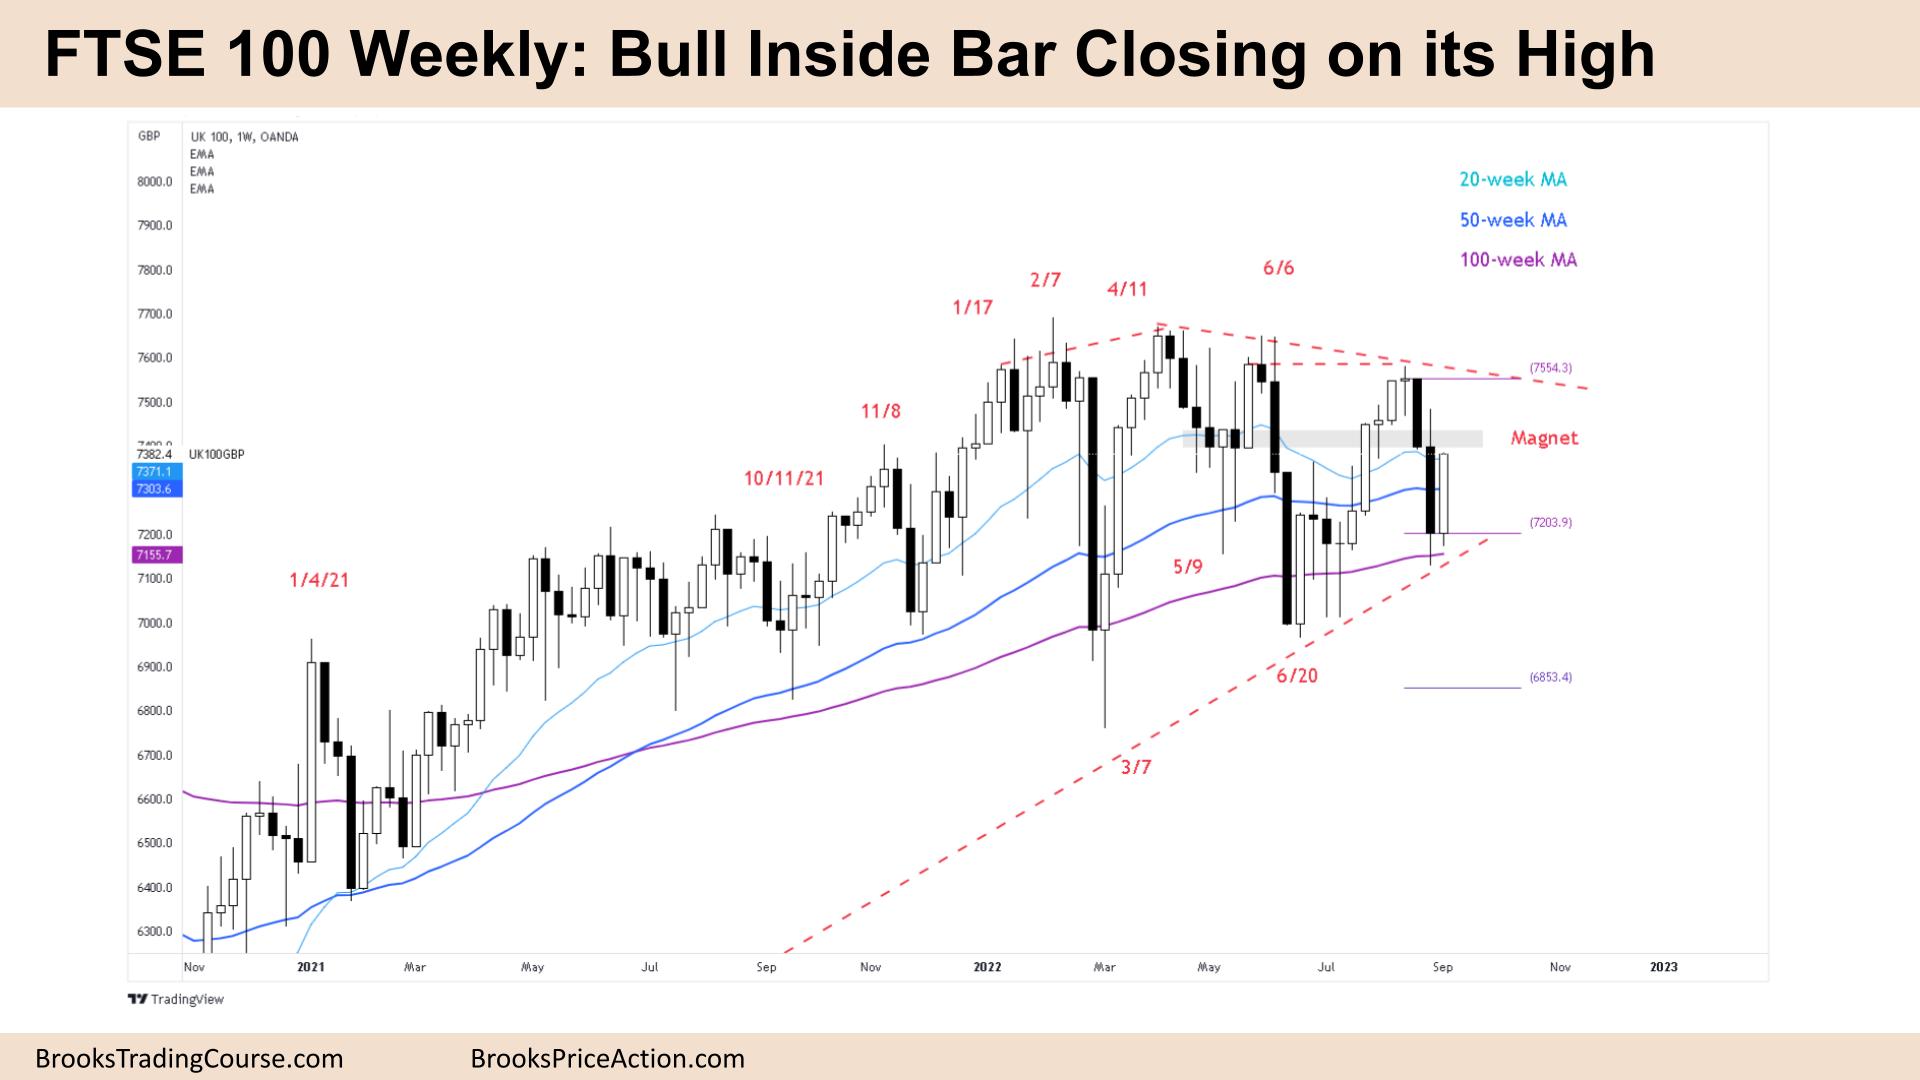
The FTSE futures market last week was a FTSE 100 bull inside bar closing on its high. With a tight trading range above we should reach that magnet before traders decide. The bulls see trend resumption up from support at the 100-week moving average. The bears see consecutive big bear bars closing on their lows. Because it’s a trading range it never looks bearish until the bottom, nor bullish until it reaches the top. This forces traders to do the opposite of what they should be doing to make money – buy low sell high and scalp (BLSHS.)
FTSE 100 Futures
The Weekly FTSE chart

- The FTSE 100 futures market last week was a bull inside bar closing on its high so we might gap up on Monday.
- For the bulls it’s a possible higher low major trend reversal up from June. It’s a micro double bottom (Micro DB) with the tails below last week. But it’s an inside bar which means a tight trading range and breakout mode either way.
- They see the 7-bar micro channel and expected the first reversal to be minor.
- The bulls also see a trend resumption with support here at the 100-week moving average (MA.)
- They want a bull follow-through bar, preferably big and closing above its midpoint. It will be a High 1 if we trade above it next week.
- But the problem is location, in the middle of a 6-month trading range and after two consecutive strong bear bars is a bad buy signal.
- The bears see those consecutive big bear bars closing on or near their lows and believe we are always in short. The tail 2 weeks ago made it more difficult to sell but they will look to sell a High 1.
- How can the High 1 be a buy and sell signal – because it’s a trading range, where the probability is at best 50/50. So the math would be better to buy low and sell high and scalp (BLSHS.)
- The bears see a lower high major trend, reversal with June and April.
- The tight trading range from May is a magnet and we have been oscillating around it for months and might continue to do so while traders decide where the new range should be.
- After a 2-year bull trend, traders expected a trading range before a continuation or bear trend, which explains why even with strong bear bars into the lows of the range there was no follow-through and they became sell climaxes.
- If you had to be in, better to be short or flat but traders might exit above last week and look to short again.
The Daily FTSE chart

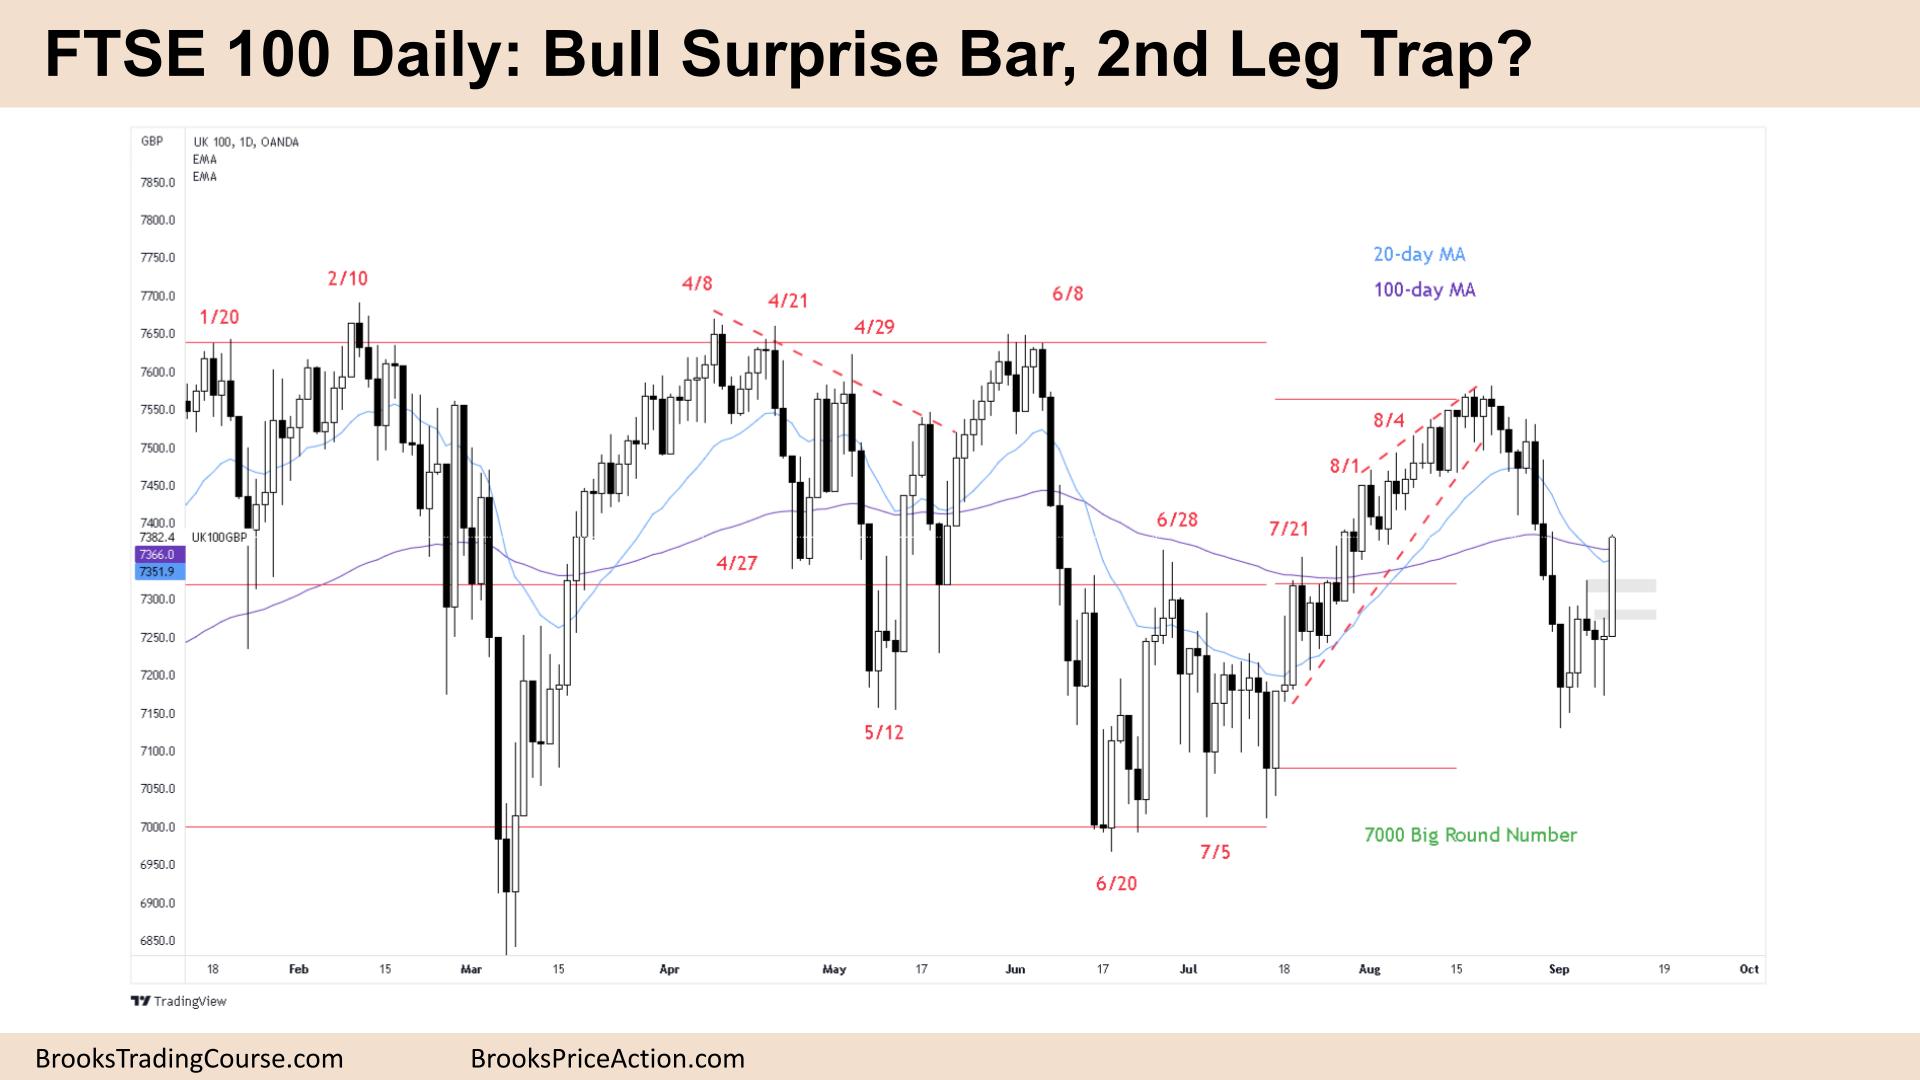
- The FTSE 100 futures was a bull surprise bar closing on it’s high so we might gap up on Monday.
- For the bulls it was a wedge bottom and higher low major trend reversal in July and we are testing the breakout point. It’s a deep pullback after a 25-bar small pullback bull trend and they expected two legs sideways to down.
- It’s a bull inside bar on the weekly which is breakout mode and 50/50 either way.
- Unfortunately for the bulls, it could be a 2nd leg trap. The 2nd leg trap happens when bears stop selling low and the market races up and traps bulls into buying too high in the range. No one is willing to buy above and without follow-through, it reverses down climatically.
- The bears see a bear spike and expect a channel to form here around the moving average. It’s above the midpoint of the trading range so the math is better for selling.
- Thursday was a bull doji, which is a bad buy signal, so we should test back down to the high next week.
- But Friday, a big bull bar closing on its high was surprisingly big, so it’s not a good sell signal, Monday might go sideways while traders decide.
- The spike down over 4 days was so strong and this reversal might create enough short-covering to get back up to the bull bar at the moving average.
- Most traders should avoid trading in the middle of a range where reversals are common and you have to do the opposite of what is appearing. Buying bear bars and selling bull bars.
- Better to be long or flat, nothing to sell yet until there is a Low 1 or Low 2.
Market analysis reports archive
You can access all weekend reports on the Market Analysis page.