Market Overview: FTSE 100 Futures
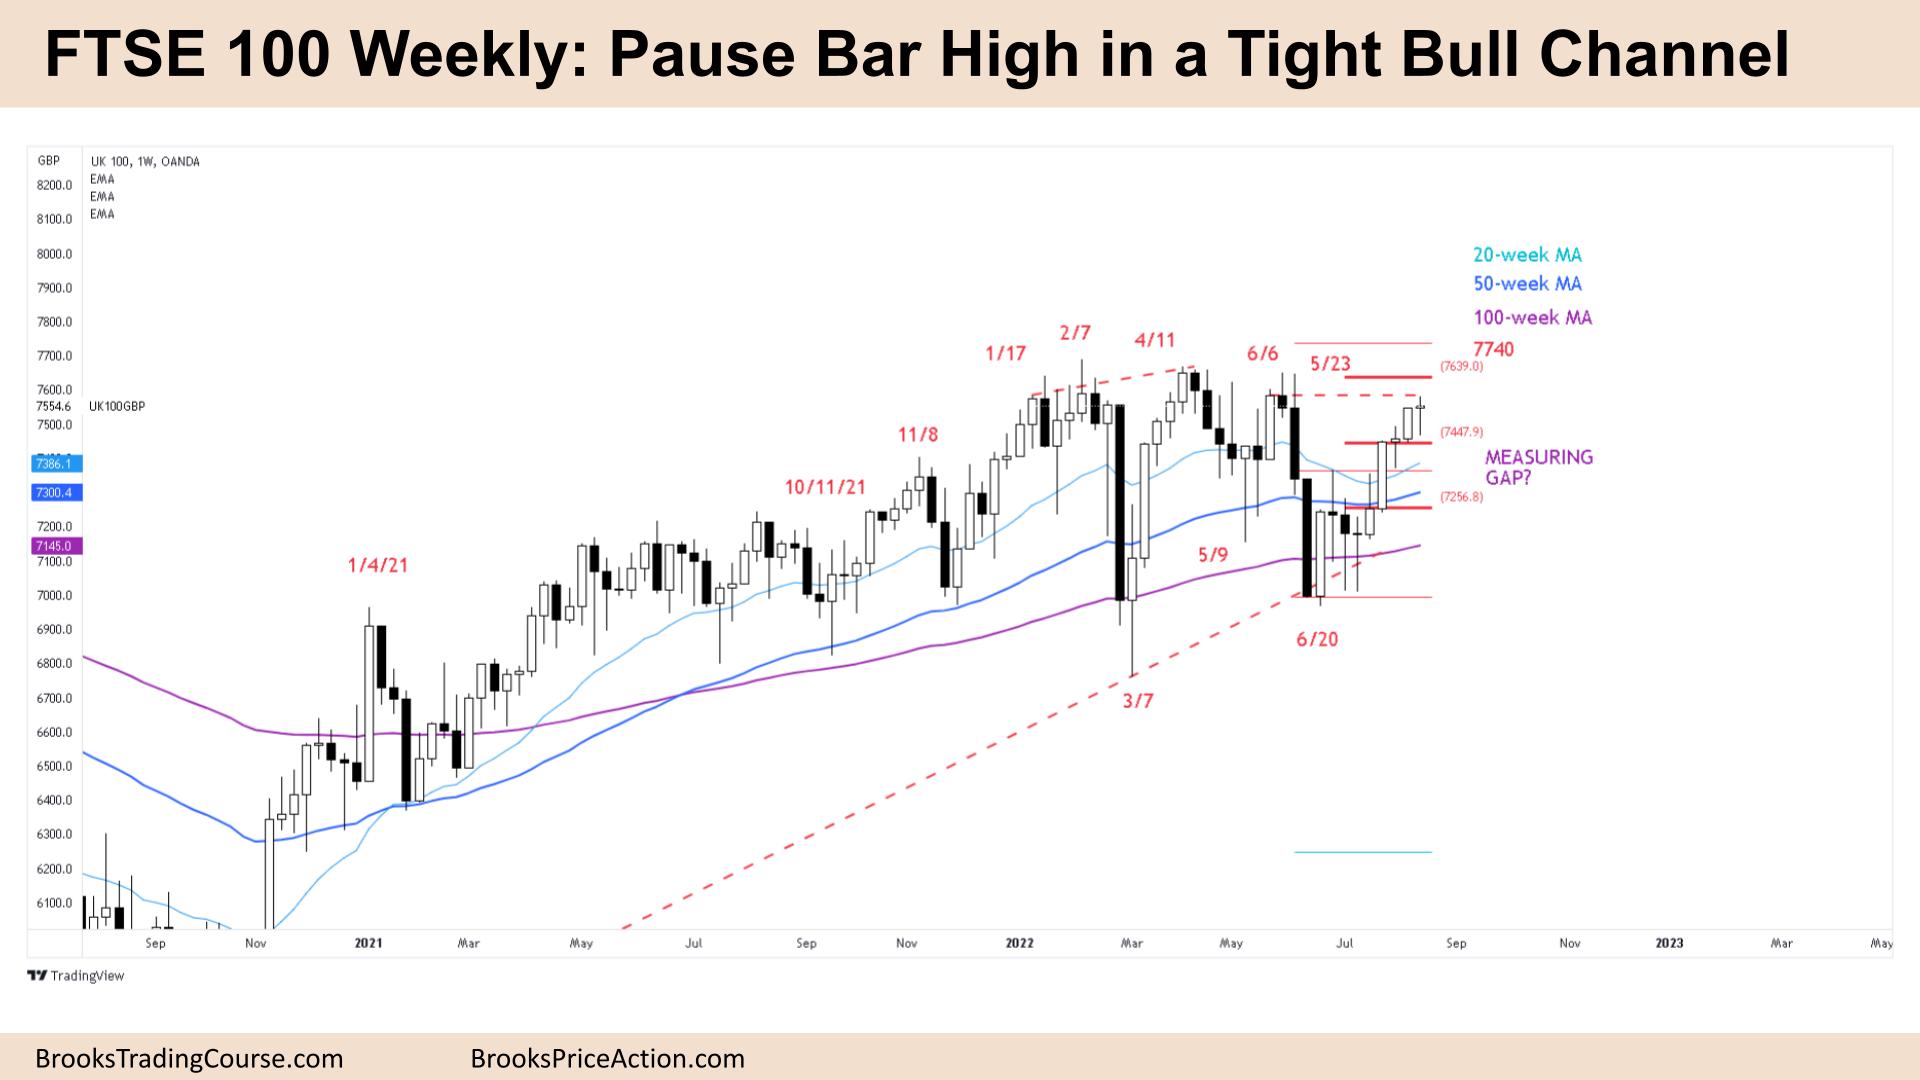
FTSE 100 pause bar high in a tight bull channel. We are always in long but at potential measured move targets on the daily chart, which is why we are going sideways here. Traders are deciding if there are enough bulls to buy above here betting on a new all-time high, or if we will remain in this trading range.
FTSE 100 Futures
The Weekly FTSE chart

- The FTSE 100 futures weekly chart was a small bull doji, a pause bar high in a tight bull channel.
- We are always in long and most traders should only be looking to buy.
- For the bulls, it’s been 6 bars since we had a pullback, which is a bar trading below the low of a prior bar. So traders will expect the first reversal to be minor.
- They see a double bottom trend resumption from the moving averages and want the trend to continue higher above the pre-pandemic highs.
- The bulls want to go above June 6th to the two measured move targets above. One from the measuring gap at 7365, and one from the length of the breakout surprise bar 3 weeks ago.
- The problem is we have not had consecutive big bull bars closing above their midpoints. Breakout bar, doji, breakout bar, doji. So the trend is not as strong as it could be and could become exhausted.
- The bears see a trading range and a lower high major trend reversal, followed by another lower high.
- They see a bear channel starting from April, a possible double top here with May and June and will look to sell above bars and possibly a Low 1.
- A Low 1 is a lower probability sell signal in a tight bull channel, and most traders can get a higher probability by selling a Low 2 high in the range.
- But the bears have not had a good sell signal yet. They want a bear bar closing below its midpoint and a follow-through bar.
- Bears have been selling here for the past 12 months and scaling in higher to make money so we should expect them to continue doing this until it is no longer profitable.
The Daily FTSE chart

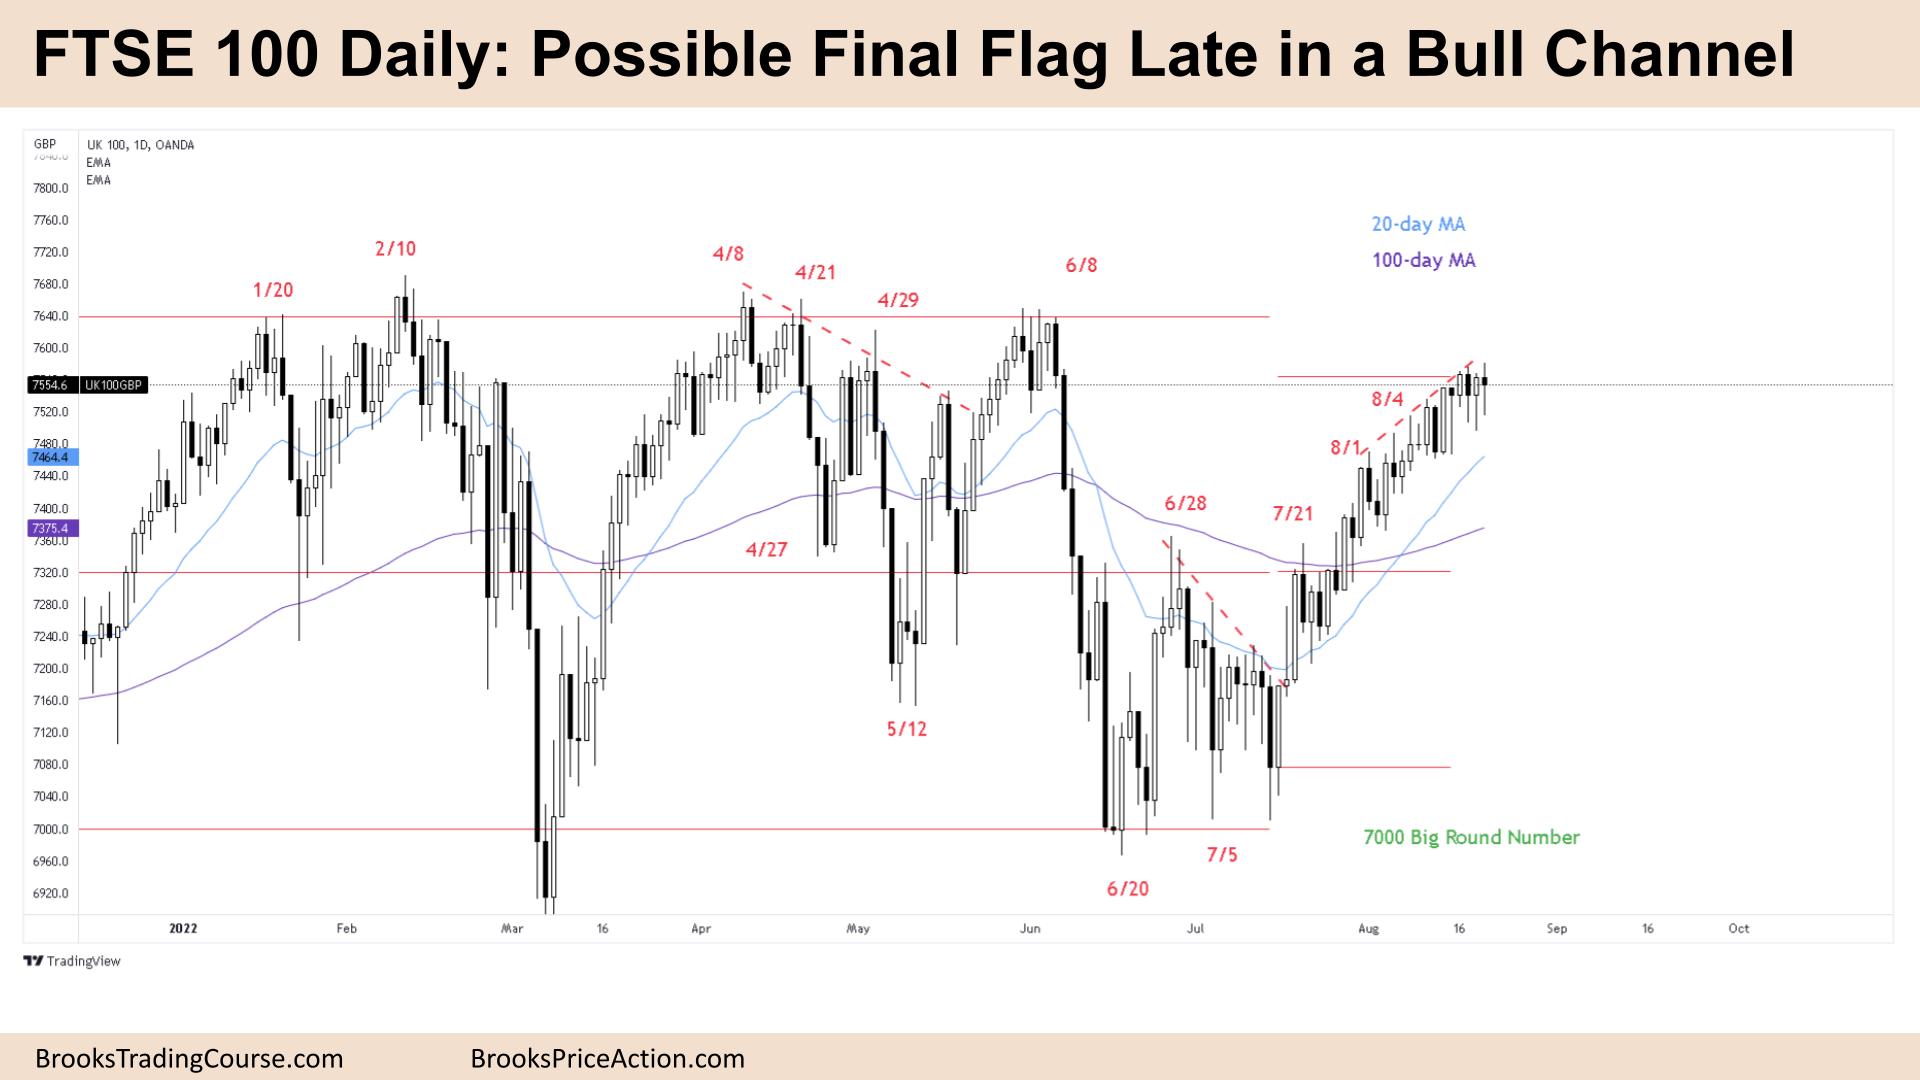
- The FTSE 100 futures daily chart was a bear doji on Friday another pause bar.
- We have been going sideways all week, with a lack of buyers above last week’s strong bull breakout bar – what does that tell us?
- Both sides see a tight trading range (barbwire), and expect 80% of breakouts from here to fail and 50% of strong moves in either direction to retrace back here.
- It’s a possible final flag, late in a bull trend and equal odds of moving up to the measured move targets, or falling back to the moving average.
- For the bulls it’s a tight bull channel, it’s been more than 4 weeks since we touched the moving average, so they expect the first pullback to be minor.
- The bulls want a two-legged pullback to the moving average to buy lower. They have been paying above average for so long, most traders would look to scale back in long there.
- The bulls also see an expanding triangle – April, May, June, and July as the 4 points waiting on a 5th to go higher.
- For the bears, it’s a lower high, a possible double top, high in a trading range. It’s been a bear channel since April and they know we sold off strongly here all year.
- The bears see the measured move on the daily chart and will look to scale in here.
- The bears have not had consecutive big bear bars for 2 months, so most traders should not be looking to short just yet.
- Expect limit order bears to sell above the range hoping for the bulls to give up. And limit and stop order bulls to try to hit the measured move target above.
Market analysis reports archive
You can access all weekend reports on the Market Analysis page.