Market Overview: FTSE 100 Futures
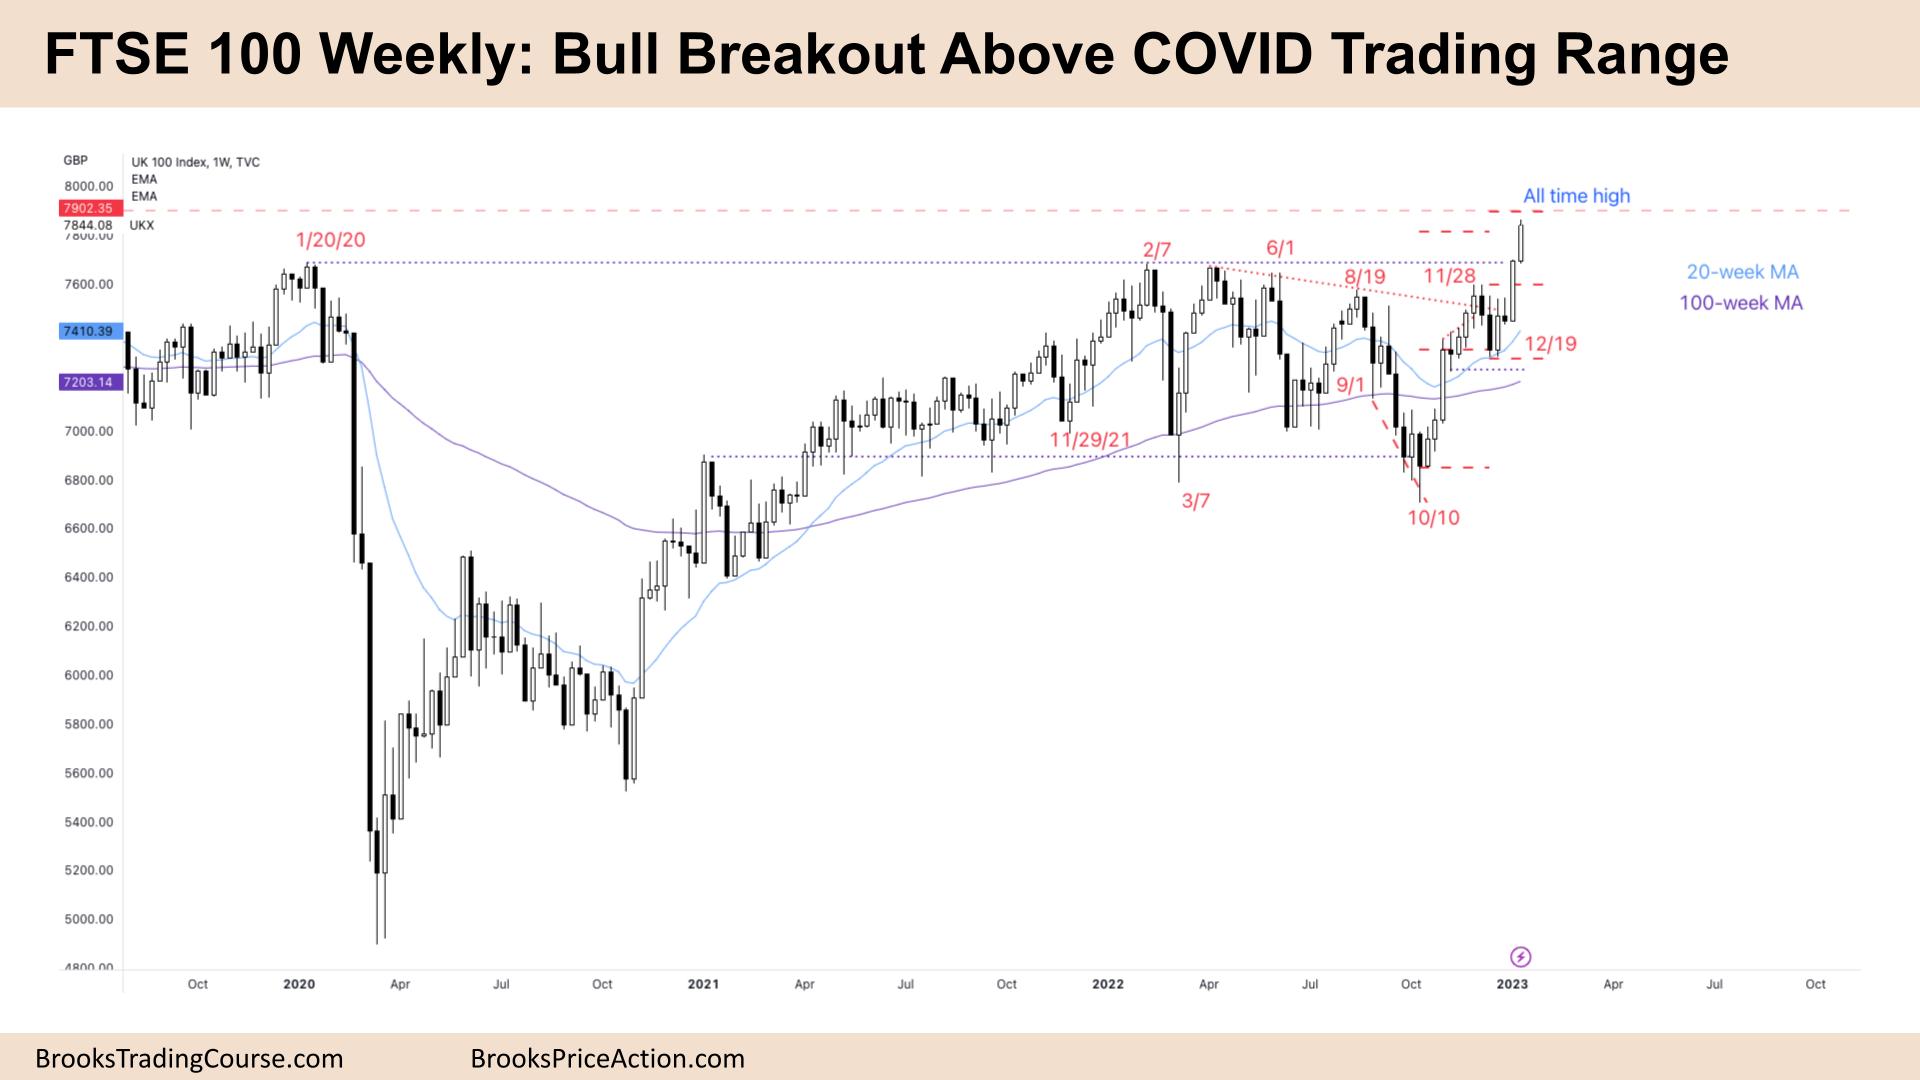
The FTSE futures market had a big bull breakout above COVID trading range. We are within striking distance of the All-Time-High. The bulls want to break strongly above the all-time high, and with consecutive weekly bull bars, it looks promising. But having spent so long in a trading range, the math favors a move back into a broader trading range above. Likely sideways to up next week, but expect sellers to come in hot over the next few months.
FTSE 100 Futures
The Weekly FTSE chart

- The FTSE 100 futures was a bull breakout, closing above the prior and COVID trading ranges.
- The bulls see a bull breakout above a bull flag and are looking for a measured move of the whole flag.
- The first target, though, is a measured move of the weekly pullback to Dec 19th. We are very close to this target and should pause soon.
- The bulls want the COVID trading range to be the long-term measured move higher, though if this is to work, it will take a few years to get there.
- The bears see a spike and channel with a deeper pullback, a higher high major trend reversal. So they want a lower high over the coming weeks.
- They want the last two weeks to be a second leg trap, trapping bulls into a bad long. But traps work on both sides, so bears will also be trapped out of shorting here.
- Its consecutive bull bars mean we are always in long, a buy signal. We can expect a test back to the top of the range before a substantial move higher. There are a few breakout points that could be magnets.
- Why the BO points? Trading ranges tend to overshoot and test these points before moving on.
- Look left – we have been in a trading range for several years. The COVID range is broad, and the past year has been tight.
- Traders should be mindful of disappointment and failed breakouts providing excellent swing entries in the opposite direction.
- Traders should expect sideways to up next week, always in long. Better to be long or flat.
The Daily FTSE chart

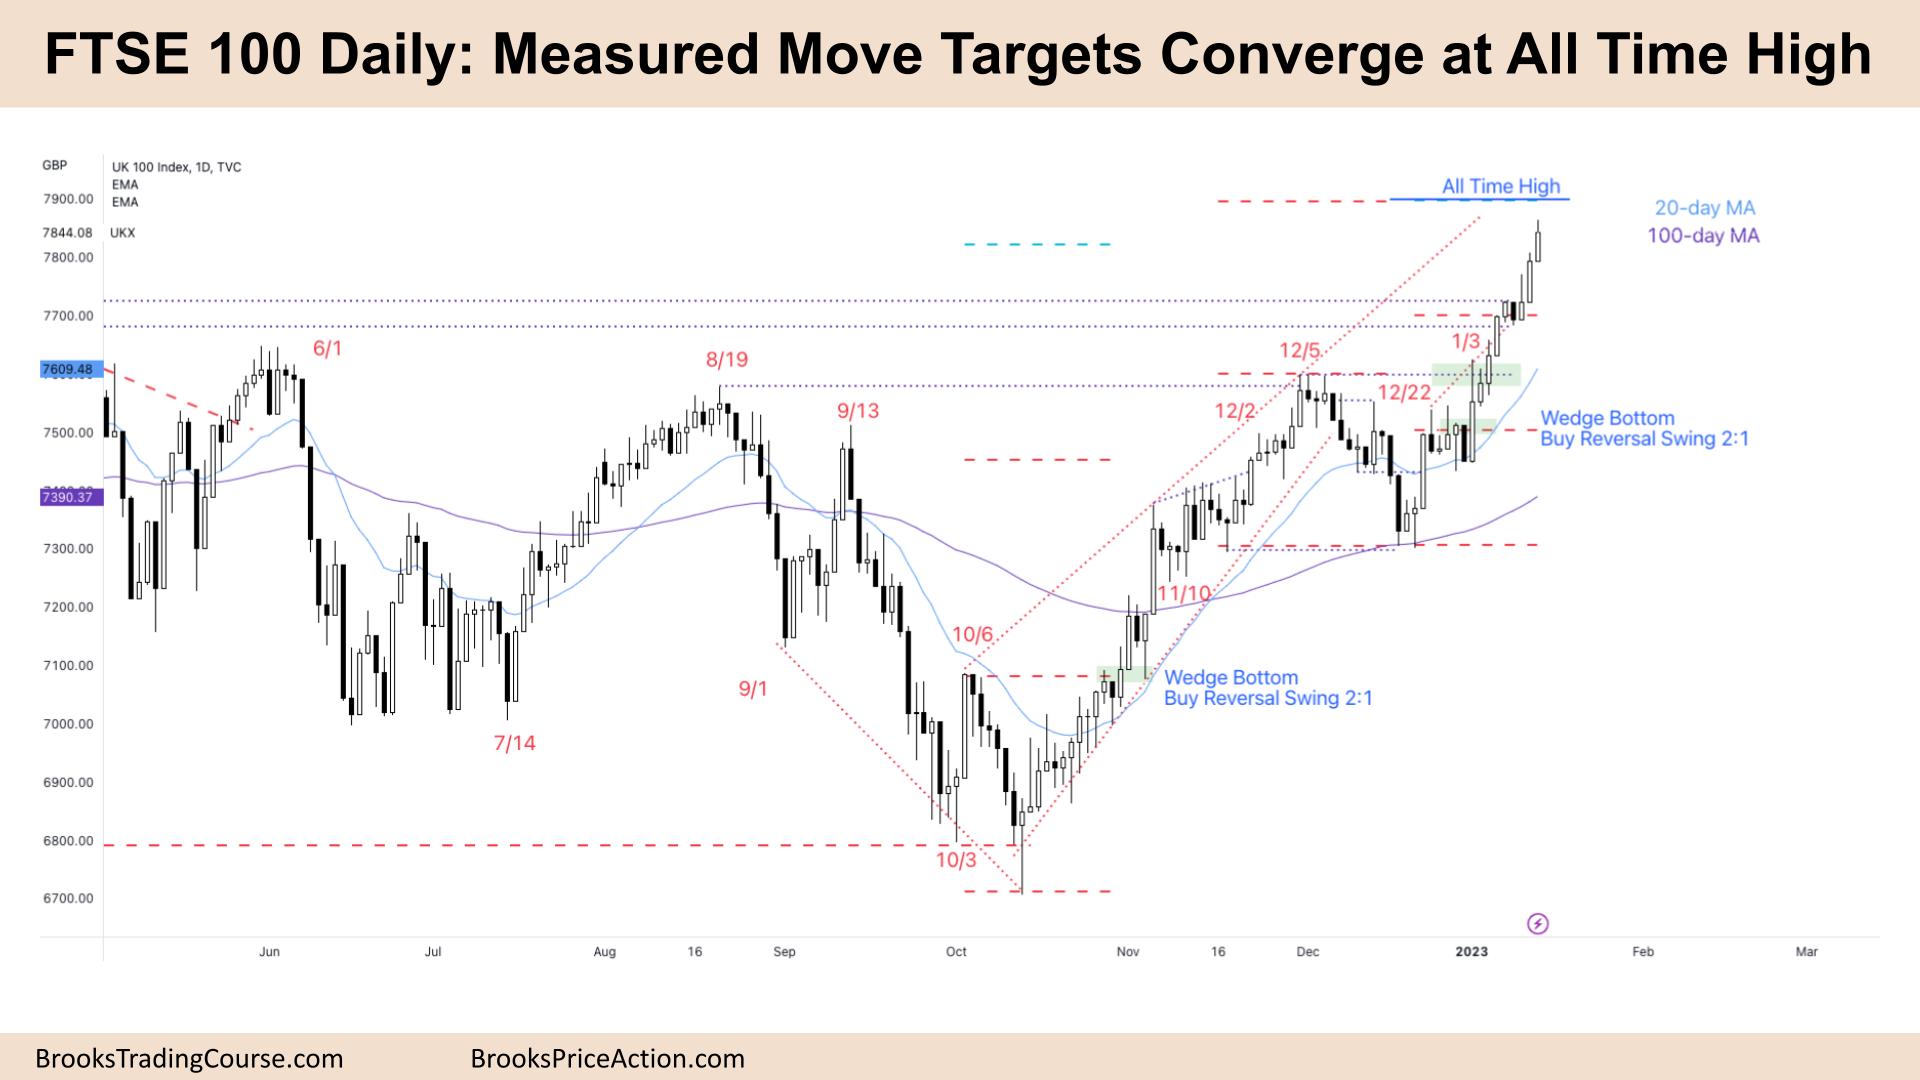
- The FTSE 100 futures was a bull bar on Friday with a small tail above.
- It is the third consecutive bull bar, so we are always in long. Traders should only be looking to buy, take profits on buys, or be flat.
- Last week completed a 5-bar bull micro channel, and we said that the first bar to go below the low of a prior bar would attract buyers. That was Tuesday.
- Traders expected a measured move up after such a strong bar last week.
- Bears got trapped selling the double tops, so we might come back to let them out or get a stronger exhaustive gap-up.
- The bulls see a tight bull channel, always in long. They have been buying above, at close and buying below.
- But the move is strong, so the open profit is also, and bulls will need to reduce risk along the way. Consecutive big bars later in a trend might attract profit taking.
- The bulls want to hit a convergence of measured move targets above: 2 x Wedge bottom swing buys and an inverse head and shoulders, double bottom bull flag breakout.
- Do we have to reach them? Not necessarily. Bulls will protect open profit and close, creating a wedge top if we stall here.
- Bears see a breakout above a smaller trading range and know we will probably reach the prior trading range high, so why sell now? They will look to sell at the ATH and higher, betting on a failed breakout. This is a reasonable strategy.
- But there is no sell signal as yet, so only limit bears will be selling.
- Most traders should be long or flat.
Market analysis reports archive
You can access all weekend reports on the Market Analysis page.