Getting ready to day trade tomorrow’s FOMC report: Updated 6:59 a.m.
The Emini opened with a Trend From The Open Bull Trend. There is no Parabolic Wedge Top yet. The odds are that the 1st reversal down will be bought. While the rally is a buy vacuum test of yesterday’s high and a possible high of the day, the odds favor at least one more push up.
The Emini is now at the top of the 9 day tight trading range. However, this opening rally has been strong enough so that there is a 50% chance that we have seen the low of the day. There is only a 25% chance that this 1st reversal down will be the high of the day. If the bears create a series of strong bear bars, they could take control.
The odds at the moment favor more sideways to up. Yet, because the Emini is at the top of a 9 day range and most days have spent a lot of time in tight trading ranges, the Emini might soon enter a tight range that could last hours.
Breakout Mode before tomorrow’s FOMC report: Pre-Open Market Analysis
Yesterday sold off for the 1st hour, yet soon then entered a trading range. It was the 8th day in a tight trading range on the daily chart. This is therefore breakout mode. The Emini is probably waiting for the catalyst of the FOMC report tomorrow.
I have been saying that the odds favor a bull breakout above the tight trading range. This is because of the strong momentum up in July. Yet, because the distance to the protective stop is great (100 points) the upside is probably small. If the bulls get a strong breakout, they will raise their stops to below this trading range.
Because of so many bars without a pullback, a failed bull breakout is more likely. As a result, the Emini will probably trade down for a couple of weeks. The selloff will therefore likely have at least a couple of legs, fall 30 – 40 points, and test the breakout point.
FOMC report tomorrow
Traders know that the FOMC report usually creates a big move up, down, or in both directions. While a pullback will probably begin this week, traders always have to be ready for the opposite. Therefore, the Pain Trade would be a huge rally.
It does not matter whether the Fed raises rate or not. Hence, the Emini can trend strongly up or down, no matter what the Fed does. The important thing for traders is to divorce themselves from the fundamentals and only look at what the market is doing. If it goes up, buy. If it goes down, sell. It therefore does not matter if some expert says that the market should go one way or the other. All that matters is what the market actually does. Don’t think about the fundamentals. Price is truth.
Globex Emini
The Emini is unchanged in the Globex session, and it traded in a narrow range overnight. This is just a continuation of what the Emini has done now for 9 days.
Forex: Best trading strategies
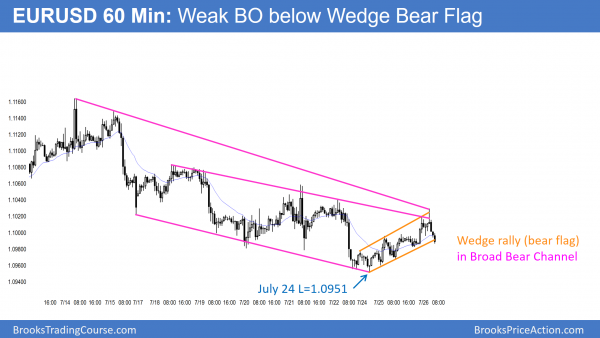
This 60 minute EURUSD chart shows the 2nd leg down from the July 5 high. That high was the top of the bear rally after the June 24 sell climax. The chart shows a Broad Bear Channel, which is a bull flag. The 2 day rally was a Wedge Bull Channel within the bigger bear channel. A bull channel is a bear flag. The EURUSD turned down 4 hours ago from the top of the bigger bear channel and is now testing the bottom of the smaller bull channel.
The EURUSD daily chart yesterday formed a bull reversal after selling off for 2 legs over the past month. Because the bear channel is tight and it is within a month long trading range, the odds of a strong bull breakout are small. Yet, most trading range breakouts fail. As a result of the EURUSD selling off to the bottom of the trading range, the odds of a bear breakout are also small.
Wednesday’s FOMC report
The Fed announcement on Wednesday will probably result in a big move. It can be up or down, or go one way and reverse. It does not matter whether they raise rates or change the wording. No one knows how much money is positioned to buy or sell. Like I said about the Emini, day traders should simply wait to see. If the EURUSD rallies, buy. If it sells off, sell. Price is truth.
European Forex session
The EURUSD has traded down in a tight bear channel for the past 4 hours. Yet, it is only 45 pips below the high. This bear reversal on the 5 minute chart follows a 3 day broad bull channel. A bull channel is a bear flag. The selloff is a breakout below the bear flag. However, it has yet to fall below a higher low in the 3 day bull channel. If it does, the rally would then be over and the chart will have evolved into a trading range. This is what usually happens after a channel up or down.
The overnight selloff was in a tight bear channel, which is a breakout on a higher time frame. Hence, the 1st reversal up will be minor. The best the bulls can realistically expect over the next couple of hours is a trading range.
60 minute bear channel, but within a trading range
The chart is not much better for the bears on the 5 minute chart. The selloff, while in a tight bear channel, has a lot of prominent tails and small overlapping bars. This is more common if the selloff is a bear leg in a trading range. Also, it is now hesitating at a higher low in the 3 day rally. This is trading range price action. While this bear leg can fall further, it is likely soon to reverse up. As a result, the 5 minute chart will then evolve into a trading range.
Until the range grows to 20 or more bars, the odds still favor at least a small breakout. However, because all time frames are in trading ranges and there is a catalyst tomorrow. the odds favor a lot of trading range price action again today.
Summary of today’s S&P Emini futures price action and what to expect tomorrow
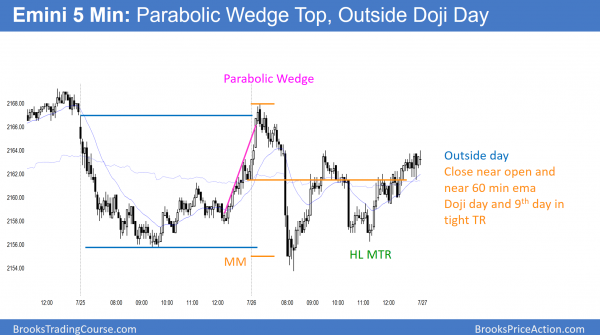
Today was the 9th day within a tight trading range. It was an outside day and a triangle, which is a neutral pattern going into tomorrow’s FOMC announcement.
The Emini has been in a tight trading range for 9 days. Tomorrow’s 11 a.m. FOMC report is a catalyst and it will probably lead to a big move up or down. Traders should ignore the pundits and only look at the charts. If the Emini is going up, look to buy, If it is going down, look to sell.
See the weekly update for a discussion of the price action on the weekly candlestick chart and for what to expect going into next week.
Traders can see the end of the day bar-by-bar price action report by signing up for free at BrooksPriceAction.com. I talk about the detailed S&P Emini futures price action real-time throughout the day in the BrooksPriceAction.com trading room. We offer a 2 day free trial.
When I mention time, it is USA Pacific Standard Time (the Emini day session opens at 6:30 am PST, and closes at 1:15 pm PST). You can read background information on the intraday market reports on the Intraday Market Update page.


Hi Al,
When there is a tight bull channel (e.g. last 8 daily candles on USD/CAD) within a trading range and it test the top of the range then does this increase the probability of bull breakout or it has no significant bearing as it is still in a trading range?
Many Thanks
Saad
In general, most trading range breakout attempts look strong enough to succeed, but still fail. I expect the attempts to be strong. However, in the particular case of the USDCAD and its 8 bar bull micro channel, that slightly increases the chances of a breakout, but the odds are still that the breakout will fail and the trading range will continue. That chart has a higher low and high and is also in the early stages of a bull channel. Without a strong, clear breakout, the odds are that the trading range will prevail. The FOMC report might be a catalyst for a breakout or a reversal down.
Hi Al,
greatly appreciate your work! Super if you could answer my question from yesterday?
Hi Al,
thanks for the info on how to draw measuring gaps. I had never understood that one should use the breakout point before, that it is the highest probability place – very interesting.
And then I presume you mean that if prices move clearly beyond that target you move to the midpoint as a second alternative.
Thanks a lot!