Emini August breakout to a new all time high
I will update again at the end of the day.
Pre-Open market analysis
The Emini rallied again on Friday and closed about 7 points below the all-time high. The cash index made a new high on Wednesday and again on Friday. The bulls want follow-through buying today and a close at a new all-time high. Whether or not they achieve their goal, the bull trend is strong. Since the weekly bull channel is tight, the odds continue to favor higher prices.
Since last week closed on its high, if today gaps up, there would be a gap on both the daily and weekly charts. A big gap up could be above the January all-time high. This would increase the chance of a bull trend day today.
It also increases the chance of a bear trend day. If there is a gap up and an early reversal down, today could be the start of a swing down on the daily chart. The bull case is more likely. Because of the increased chance of a trend day, day traders will look for an early swing entry up or down.
Overnight Emini Globex trading
The Emini is up 11 points in the Globex session. If it opens here, it will gap up to a new all-time high on the daily and weekly charts. A breakout above major resistance increases the chance of a trend day. Up is more likely than down. Furthermore, the Emini is close to breaking above a bull channel in addition to the 8 month trading range breakout. This could result in a surprisingly strong series of trend days over the next week.
While most breakouts above bull channels fail, this one has a higher probability of success because it is also a breakout above a trading range. The result can be a very strong breakout.
The breakout is probably the start of a 300 point measured move rally. Even so, the Emini often goes sideways for several days when it breaks above resistance. Furthermore, it could still pull back below the breakout point and form another bull flag before it continues up.
Friday’s setups
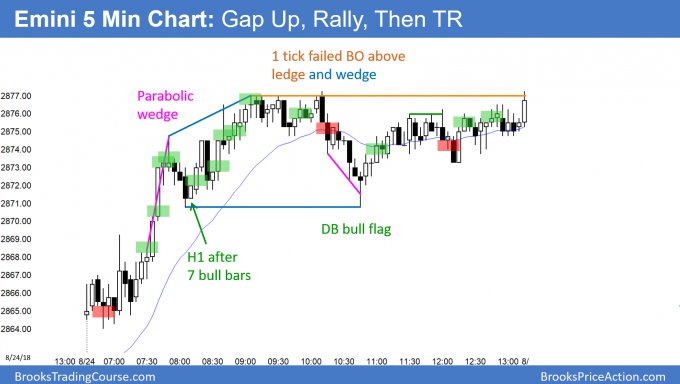
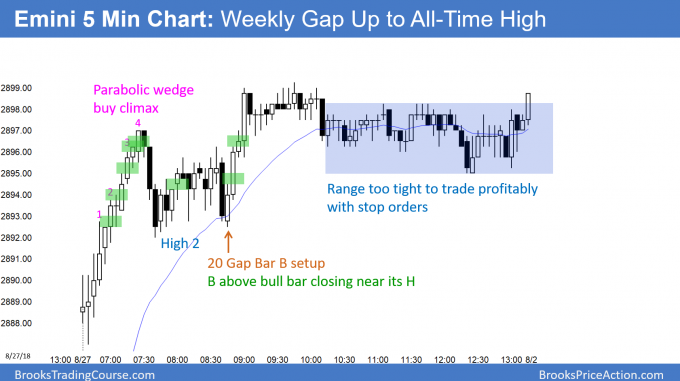
Here are several reasonable stop entry setups from Friday. I sometimes also show limit order entries and entries on the close of bars. My goal with these charts is to present an Always In perspective. If a trader was trying to be Always In or nearly Always In a position all day, and he was not in a position at the moment, these entries would be logical times for him to enter.
EURUSD Forex pause in bull trend reversal
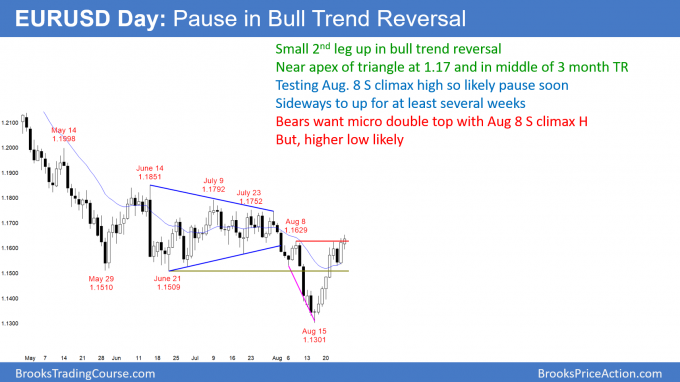
The EURUSD daily Forex chart rallied for 2 days after a 7 day buy climax. It will probably begin to enter a trading range.
The EURUSD daily Forex chart rallied for 2 days after a one day High 1 bull flag. The 7 day reversal up was strong and the context was good enough for a bull trend reversal. Consequently, the odds are that the August low will hold for at least a couple of months. Since the weekly chart has been in a bull trend during the 8 month selloff, this low could hold for many months.
I said last week that the 1st pullback might last only a day, which it did. In addition, I said that the trend resumption up might last only a few days. This is because that is what usually happens when there is a buy climax to resistance. Here, the resistance is the August 8 sell climax high.
Likely resumption of bull trend on weekly chart
The reversal is strong on the daily chart and the pullback on the weekly chart is probably ending. Therefore, the daily chart will probably go sideways to up for at least several more weeks. However, Big Down, Big Up creates Big Confusion. Confusion is a hallmark of a trading range. In addition, the daily chart is back to a price level where traders thought the price was fair from May through July. They will probably again believe it is fair. Consequently, the daily chart will probably go sideways for at least a month.
Trading ranges have legs up and down. The odds are that there will be a test down within the next couple of weeks. It could easily retrace half of the current rally and to below the June 21 bottom of the 3 month trading range.
Less likely, the bull trend reversal will continue up in a Small Pullback Bull Trend and break strongly above the June 14 high with a leg down first.
Overnight EURUSD Forex trading
The EURUSD 5 minute Forex chart had legs up and down overnight. Most of the bars were in small tight trading ranges. Day trading bears have been making money selling new highs, despite the bull trend. They will continue to do so today. When bears find it easy to make money in a bull trend, the trend is weakening. It usually soon enters a trading range. That is what is likely over the next week. The range will probably be between 1.15 and 1.17.
Summary of today’s S&P Emini futures price action and what to expect tomorrow
Here are several reasonable stop entry setups for today. I sometimes also show limit order entries and entries on the close of bars. My goal with these charts is to present an Always In perspective. If a trader was trying to be Always In or nearly Always In a position all day, and he was not in a position at the moment, these entries would be logical times for him to enter.
After a gap up to a new high and an 11 bar rally on the open, the Emini entered a trading range. The Emini often goes sideways for 2 – 4 days after breaking above resistance. That is likely here. The bears want a gap down tomorrow and an island top, but higher prices are more likely.
If the bulls begin to get a series of bull days closing on their highs, the rally could quickly reach the measured move targets at around 3100 and 3200. More likely, the rally to the targets will have pullbacks and be in a bull channel instead of entirely in a breakout.
See the weekly update for a discussion of the price action on the weekly candlestick chart and for what to expect going into next week.
Traders can see the end of the day bar-by-bar price action report by signing up for free at BrooksPriceAction.com. I talk about the detailed S&P Emini futures price action real-time throughout the day in the BrooksPriceAction.com trading room. We offer a 2 day free trial.
When I mention time, it is USA Pacific Standard Time (the Emini day session opens at 6:30 am PST, and closes at 1:15 pm PST). You can read background information on the intraday market reports on the Intraday Market Update page.


