Emini awaiting FOMC and Trump’s special counsel decision
Updated 6:45 a.m.
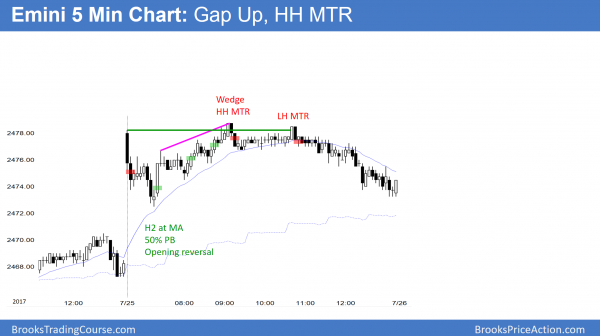
Today had a big gap up, but the day began with consecutive strong bear bars. If there is going to be a trend day, a bear trend is now more likely. While the Emini is Always in short, the odds are that it will go sideways for 5 – 10 bars. The bulls will try for a double bottom opening reversal up from the moving average. The bears want a lower high and a bear trend day.
This bearish open makes a bear trend or trading range day likely. While the bulls can still get a bull trend day, the odds are against it. In addition, if they succeed, the bull trend will probably be weak.
Pre-Open market analysis
While yesterday was a bull reversal day, it was not a strong bull trend day. Instead, it was the 3rd consecutive trading range day. Friday is still a buy signal bar, but the daily and monthly charts have parabolic wedge rallies. In addition, the weekly chart has an extreme buy climax. Although the odds favor 1 – 3 days above Friday’s high, the odds are against a protracted bull breakout from here.
Furthermore, Wednesday’s FOMC announcement is a catalyst. This means that it can lead to a sharp move up or down, or in both directions. For example, the Emini could rally strongly to 2500 and then reverse down for 2 months. While it could break strongly above 2500 and continue up indefinitely, the weekly buy climax makes that unlikely.
Overnight Emini Globex trading
The Emini is up 7 points in the Globex market. It therefore will probably gap up above the 2 day bull flag and make a new all-time high. Because the daily chart is in a parabolic wedge bull channel, there is an increased chance that today’s rally will lead to a reversal down today or tomorrow.
In addition, a gap up has an increased chance of leading to a trend day. The odds slightly favor the trend being in the direction of the gap. Therefore, if today is a trend day, a bull trend day is more likely than a bear day.
FOMC catalyst tomorrow
Tomorrow’s FOMC meeting is a catalyst. Hence, it can lead to a strong move up or down. While the daily, weekly, and monthly charts are all in buy climaxes, there is no top yet. Furthermore, climactic rallies can go a long way before pausing. Hence, the odds still favor at least slightly higher prices. However, traders need to be ready for a reversal down at any point. Since it would be following an extreme climax, the 1st leg down could be big and fast.
Yesterday’s setups
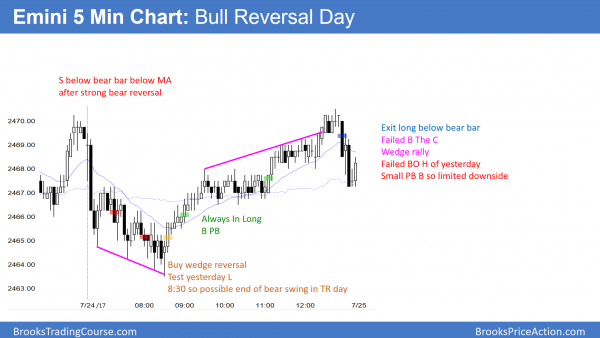
Here are several reasonable stop entry setups from yesterday. I sometimes also show limit order entries and entries on the close of bars.
EURUSD Forex market trading strategies
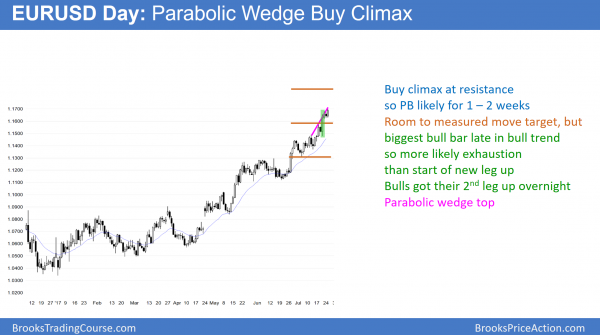
The daily EURUSD Forex chart is in a strong bull trend. However, it is too strong and too late.
Last week’s strong breakout is more likely an exhaustive buy climax than the start of an even stronger leg up.
The EURUSD Forex market is in a strong bull trend. Yet, when a bull trend accelerates after 20 or more bars, the breakout is more often a vacuum test of resistance than the start of a strong leg up.
This rally got to within a pip of the 1.1700 Big Round Number
this morning. Hence, it is within 112 pips of the 1.1712 August 24, 2105 top of the 30 month trading range. In addition, it is making a 5th push up in a parabolic wedge channel. This follows the June 27 bull breakout. This is therefore late in a spike and channel bull trend. Finally, the channel is a parabolic wedge buy climax.
Spike and Channel Bull Trend
Since spike and channel bull trends usually have bear breakouts and then they evolve into trading ranges, that is what is likely here. The process usually takes at least 10 bars. Therefore, the odds favor at least a 2 week pullback with 2 or more small legs. The target is the bottom of the wedge. That is therefore the 1.1312 July 5 low. Since that is 400 pips below, the pullback will probably require at least a month to get there.
Overnight EURUSD Forex trading
While there is a parabolic wedge buy climax on the daily chart. Thursday’s bull breakout was strong. It was therefore likely to lead to at least one more small leg up. Last night’s rally met this minimum requirement.
The 5 minute chart had a strong bull breakout about an hour ago. It stopped 1 pip below 1.1700 and 13 pips below the top of the 30 month trading range. The rally was strong enough to make at least slightly higher prices likely today.
Yet, most trading range breakouts fail. While this one is very strong, the odds are that it will pull back after breaking above the 30 month high. This is especially true because the breakout on the daily chart is in a parabolic wedge channel.
Markets have inertia
Since markets have inertia, the 30 month trading range is likely to continue at least for a couple more months. Similarly, the momentum up on the 5 minute chart is likely to lead to at least slightly higher prices today. The odds favor a break above the 30 month trading range high of 1.1712 today or tomorrow.
But, the buy climax pattern on the daily chart makes a pullback likely soon. Hence, bear swing traders will look for a bear reversal or micro double top on the daily chart. They will expect a 400 pip pullback over the next month or two. Bear day traders need a strong reversal down, which they do not yet have. In fact, with the rally of the last hour, the best they will probably get today is a trading range, not a bear trend.
Bull swing traders on all time frames keep buying because the momentum up is strong. However, they see the buy climax and know that the daily chart will probably reverse soon. They will therefore be quick to exit their longs on a reversal down. Until then, they will continue to buy. However, the odds are beginning to shift in favor of the bears.
Summary of today’s S&P Emini futures price action and what to expect tomorrow
The Emini reversed down from a gap up to a new all-time high. It then reversed up from a High 2 Opening Reversal up from the moving average. It broke to a new high and then reversed down from a major trend reversal.
While today was a trading range day, it had 2 swings down and one swing up. It closed near its low and therefore is a sell signal bar on the daily chart for tomorrow. There are parabolic wedge tops on the daily and monthly charts. Tomorrow is an FOMC meeting and therefore there will probably be a big move after the 11 a.m. announcement.
See the weekly update for a discussion of the price action on the weekly candlestick chart and for what to expect going into next week.
Traders can see the end of the day bar-by-bar price action report by signing up for free at BrooksPriceAction.com. I talk about the detailed S&P Emini futures price action real-time throughout the day in the BrooksPriceAction.com trading room. We offer a 2 day free trial.
When I mention time, it is USA Pacific Standard Time (the Emini day session opens at 6:30 am PST, and closes at 1:15 pm PST). You can read background information on the intraday market reports on the Intraday Market Update page.


Thanks Al.
Hi Al,
Can you go over the signal on bar one. Thanks
When there is a big bear bar closing on its low after a big gap up, there is a 25% chance that the bar will remain the high of the day. Bears therefore sell below its low. They are taking the chance that either the market will go sideways and give them a small profit or loss, or go down strongly and give them a profit that is many times bigger than their risk. That big swing down happens often enough to make the low probability bet mathematically valid.