Emini and Forex Trading Update:
Wednesday December 11, 2019
I will update again at the end of the day.
Pre-Open market analysis
The Emini pulled back this week from last week’s test of the all-time high of 2 weeks ago. Yesterday is a High 1 bull flag buy signal bar for today. The bulls expect higher prices and they want the year to close on its high. This is true even if there is a sharp selloff for a few days after today’s final FOMC announcement of the decade.
The bears hope that this week is forming a double top with the high from 2 weeks ago. Last week’s low is the neck line. They want a break below the neck line and then a 85 point measured move down from there.
Because the daily, weekly, and monthly charts are in strong bull trends, the bull case is more likely. Even if the bears get a selloff on today’s 11 am PST FOMC announcement, the Emini will probably make a new high within a month or two.
Overnight Emini Globex trading
The Emini is up 2 points in the Globex session. It has had mostly trading range price action for 6 days. Traders will expect the same today ahead of the 11 am PST FOMC announcement.
Day traders should get flat ahead of the report. There is typically a quick move up and down immediately after the report. There is then a 50% chance of a swing up or a swing down. Day traders should wait for at least 10 minutes after the report before resuming trading. They should wait to see consecutive strong trend bars up or down before taking a position.
The Emini can do anything after an FOMC report. It can trend in either or both directions, have multiple reversals, or simply go sideways. Never have an opinion going into the report and never listen to a TV expert if you want to make money. Simply trade what you see after the report. If the bars are big, the risk is big. Only trade if you can trade small enough so that your risk is no more than at any other time.
There were 2 ledge tops at around 3145 on Monday. These typically get tested by the close of the next day. Since the Emini did not get there yesterday and it is still near those magnets, it will probably get there today.
Yesterday’s setups

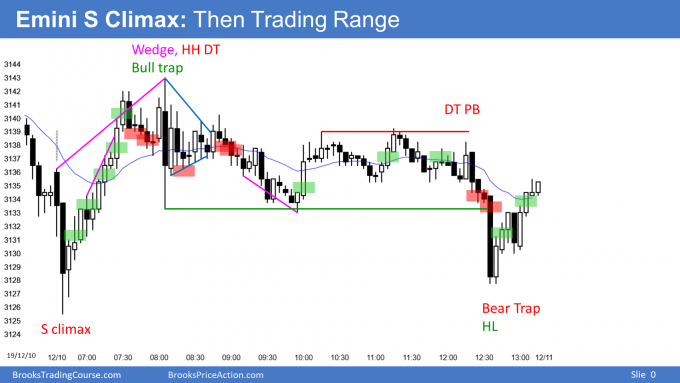
Here are several reasonable stop entry setups from yesterday. I show each buy entry with a green rectangle and each sell entry with a red rectangle. I rarely also show limit order entries and entries on the close of bars. Buyers of the Brooks Trading Course and Encyclopedia of Chart Patterns have access to a much more detailed explanation of the swing trades for each day.
My goal with these charts is to present an Always In perspective. If a trader was trying to be Always In or nearly Always In a position all day, and he was not currently in the market, these entries would be logical times for him to enter.
EURUSD Forex market trading strategies

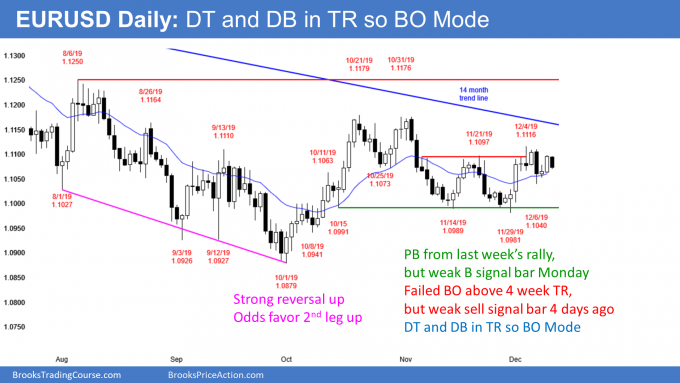
The daily chart of the EURUSD Forex market is in a 7 day tight trading range, at the top of a 5 week trading range, and in the middle of a 5 month trading range.
This is unusual and it therefore will probably end soon. The chart is in Breakout Mode. There is a 50% chance that the 1st breakout up or down will reverse. Also, there is a 50% chance that a successful breakout will be up and a 50% chance it will be down.
Even once there is a breakout, it will probably only last a few weeks. This is what has happened with every prior breakout over the past 2 years. Everyone knows that there will eventually either be a strong bull or bear trend on the weekly and monthly charts. But until there is, traders will continue to look for reversals.
Traders see the price as fair on the daily chart and are waiting for information that indicates they are wrong. There are several upcoming catalysts, including today’s 11 am PST FOMC announcement, Trump’s decision this weekend on China tariffs, and news on Brexit. Until then, traders expect reversals every few days and are unwilling to buy rallies or sell selloffs.
Overnight EURUSD Forex trading
The 5 minute chart of the EURUSD Forex market has been in a 25 pip range overnight. It is still within yesterday’s range and today so far is therefore an inside day. Day traders are looking for 10 pip scalps while they wait for a strong breakout up or down.
There is an FOMC announcement at 11 am PST today. That will affect all financial markets. Day traders should exit positions ahead of the report and wait for at least 10 minutes after the report before trading again. This is because there usually is a big move up and down within the 1st few minutes and it is easy to lose money during that time. Wait for at least a couple consecutive trend bars up or down before looking for a trade.
Also, be open to anything after an FOMC report. There can be a trend up or down, one or more big reversals, or a trading range.
Summary of today’s S&P Emini futures price action and what to expect tomorrow

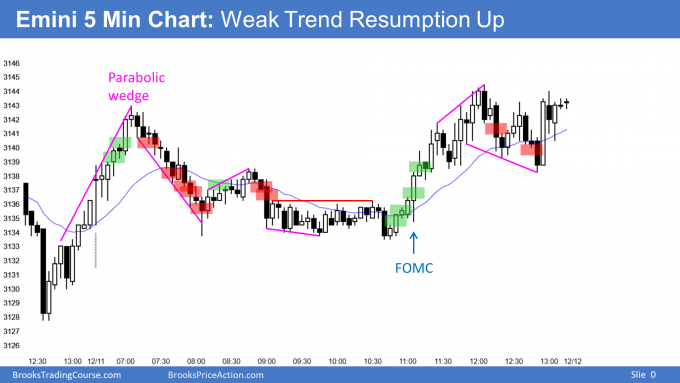
Here are several reasonable stop entry setups for today. I show each buy entry with a green rectangle and each sell entry with a red rectangle. I rarely also show limit order entries and entries on the close of bars. Buyers of the Brooks Trading Course and Encyclopedia of Chart Patterns have access to a much more detailed explanation of the swing trades for each day.
My goal with these charts is to present an Always In perspective. If a trader was trying to be Always In or nearly Always In a position all day, and he was not currently in the market, these entries would be logical times for him to enter.
End of day summary
The Emini formed another trading range day. There was a weak rally after the FOMC report.
Traders are deciding if the bulls will rally to above last week’s high. That would trigger a High 1 buy signal on the weekly chart. It would probably lead to a new all-time high.
Alternatively, the bears want a double top with the high from 2 weeks ago. The 4 sideways days indicate that neither side has taken control yet. The odds favor more trading range trading again tomorrow.
See the weekly update for a discussion of the price action on the weekly chart and for what to expect going into next week.
Trading Room
Traders can see the end of the day bar-by-bar price action report by signing up for free at BrooksPriceAction.com. I talk about the detailed S&P Emini futures price action real-time throughout the day in the BrooksPriceAction.com trading room. We offer a 2 day free trial.
Charts use Pacific Standard Time
When I mention time, it is USA Pacific Standard Time (the Emini day session opens at 6:30 am PST, and closes at 1:15 pm PST). You can read background information on the intraday market reports on the Market Update page.
You don’t have a sell entry for the 2nd bear bar closing on it’s low after the parabolic wedge on the open. I would think this a good entry as it was the Monday open and reversed two times in previous days. I saw this as a reversal on the open which you speak about in your tutorials. I took it and it turned out nicely. Just wondered if you see something I’m not.
I thought about it and it was a reasonable short. But with the tail below that bar, I often wait to see if the next bar closes near its low, which it did. At that point, it is a higher probability short.