Trading Update: Monday August 30, 2021
Emini pre-open market analysis
Emini daily chart
- Friday made another new all-time high with Emini big bull bar on monthly chart.
- With last week closing near its high, this week could gap up today, creating a gap on the weekly chart.
- Friday was a buy climax day. The day after a buy climax day has a 75% chance of at least a couple hours of sideways to down trading that begins by the end of the 2nd hour.
- Two trading days left in August, and the Emini is far above the open of the month. August will probably have a bull body and be the 7th consecutive bull bar on the monthly chart.
- There has never been a streak of 8 consecutive bull bars on the monthly chart in the 25-year history of the Emini. Therefore, September will probably have a bear body.
- If it does, that should lead to a 2- to 3-month correction of 15 to 20%.
- Bars often change their appearance just before they close. August is a bull bar that is currently trading at the high with 2 days left in the month. That means there is an increased risk of a 50-point selloff over the next two days. It would take about 50 points of selling to add a noticeable tail on the top of the monthly candlestick.
- Alternatively, the bulls would be happy having the month close near the high. That would increase the chance of a gap up on the monthly chart on Wednesday.
- There is no great need for a rally over the next couple days. The bulls will have accomplished a lot if they can simply keep the Emini near its high through the end of the month tomorrow.
- There have been many reversal attempts on the daily chart over the past year and a half. Traders bought every one, correctly betting against a successful reversal.
- They will continue to bet on higher prices until there is a very strong reversal down. Once they see a reversal down that is strong enough to make them think a correction is underway, the correction will be half over.
Emini 5-minute chart and what to expect today
- Emini is up 6 points in the overnight Globex session.
- It will likely gap up, which would create a gap on the weekly chart as well as the daily chart.
- If it does and the gap is small, it will probably close in the 1st hour.
- Friday was a buy climax day. There is therefore a 75% chance of at least a couple hours of sideways to down trading that starts by the end of the 2nd hour today.
- Friday formed a trading range for the 2nd half of the day. That also increases the chance of an early trading range today.
- With the Emini overbought and at the high of the month at the end of the month, there is a reduced chance of a big bull day.
- The bears want a 50-point selloff before tomorrow’s close.
- Most likely, the Emini will be mostly sideways around the high of the month today and tomorrow.
Friday’s Emini setups

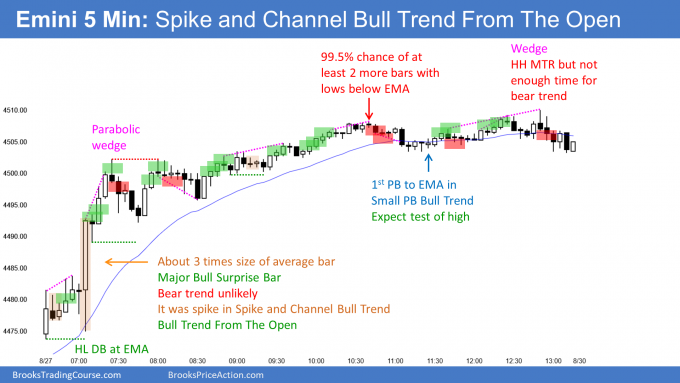
Here are several reasonable stop entry setups from Friday. I show each buy entry with a green rectangle and each sell entry with a red rectangle. Buyers of both the Brooks Trading Course and Encyclopedia of Chart Patterns have access to a much more detailed explanation of the swing trades for each day (see Online Course/BTC Daily Setups).
My goal with these charts is to present an Always In perspective. If a trader was trying to be Always In or nearly Always In a position all day, and he was not currently in the market, these entries would be logical times for him to enter. These therefore are swing entries.
It is important to understand that most swing setups do not lead to swing trades. As soon as traders are disappointed, many exit. Those who exit prefer to get out with a small profit (scalp), but often have to exit with a small loss.
If the risk is too big for your account, you should wait for trades with less risk or trade an alternative market like the Micro Emini.
EURUSD Forex market trading strategies
EURUSD Forex daily chart

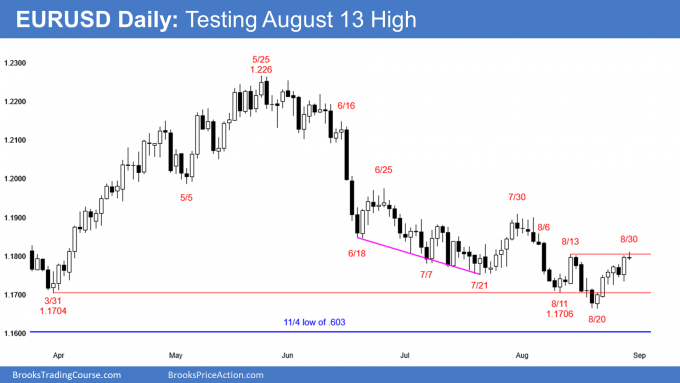
- Friday was an outside up day, but today so far is only a small doji bar. That is weak follow-through and increases the chance of a pullback for a few days.
- This is especially true after disappointing follow-through buying after the 1st 2 days up from the low.
- If there is a pullback, the EURUSD will probably test the bottom of the most recent buy climax, which is Friday’s low. That is also around a 50% pullback.
- I mentioned on August 20 that the EURUSD should rally for a couple weeks and have at least a couple small legs up. That is still true, but unless today or tomorrow breaks strongly above the August 13 high, there will probably be a test down for a few days.
- The bulls need 2 closes above the August 13 lower high. If they get that, the rally should continue up to the July 30 lower high or the June 25 lower high.
- The bears want a reversal down from a double top with the August 13 lower high. They probably will not get a strong break below the August 20 low, which is the neckline. There should be buyers below the November low, which is the bottom of the yearlong trading range.
- Tomorrow is the final day of August. On the monthly chart, August is a reversal bar because it is now trading above its midpoint.
- However, it still has a bear body and it is therefore a weak buy signal bar.
- The bulls will try to get the month to close on its high. If they succeed, September should trade at least a little above the August high. A rally could continue up to the middle of the yearlong trading range over the next couple months.
Summary of today’s S&P Emini futures price action and what to expect tomorrow

End of day summary
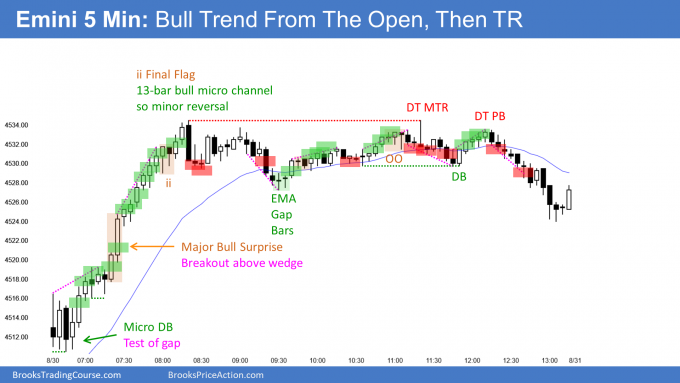
- On the open, micro double bottom just above Friday’s high. Bears unable to close the gap.
- Strong Bull Trend From The Open, and then trading range.
- High was within 2 ticks of 4537 measured move target, based on height of pandemic crash.
- Trading range for several hours.
- Reversed down from double top major trend reversal. Led to a minor selloff to just below the bottom of the trading range, which was the neckline of the double top.
- Tomorrow, the bulls want trend resumption up from today’s early rally, and the bears want trend reversal down into the end of the month.
- Since bears failed to get reversal down to open of the month and month is now at the high, August will likely close near the high of the month. The bulls only need tomorrow to be sideways to achieve this.
- If tomorrow closes near the high of the month, September might gap up on Wednesday.
- While September is the weakest month on average, it is usually not much different from any other month.
- There is a bullish tendency through September 5.
- If September is to close below its open, it might rally for the 1st half of the month after a strong August.
- The September 22 FOMC announcement could be a catalyst for a big move up or down. If September is up at that point, it could lead to a selloff into the end of the month and into October.
See the weekly update for a discussion of the price action on the weekly chart and for what to expect going into next week.
Trading Room
Traders can see the end of the day bar-by-bar price action report by signing up for free at BrooksPriceAction.com. I talk about the detailed S&P Emini futures price action real-time throughout the day in the BrooksPriceAction.com trading room. We offer a 2 day free trial.
Charts use Pacific Time
When I mention time, it is USA Pacific Time. The Emini day session charts begin at 6:30 am PT and end at 1:15 pm PT which is 15 minutes after the NYSE closes. You can read background information on the market reports on the Market Update page.
Hi Al,
If the day opens above a trading range with a bear bar followed by a bull bar approximately the same size like today or 2 days ago what does it mean? Does it have any predictive value for the day? Is it a trend in the direction of the second bar more likely or is it still 80% likely the breakout above the trading range will fail? Thank you.
When things are not clear, traders want to see more bars. They often look for 2 attempts to do something. Today, the bears twice tried to close the gap up above Friday’s high and failed both times (bars 1 and 3). When the market tries to do something 2 or more times and fails, it often tries the opposite direction.
On the open, I would not expect an 80% chance of a reversal back into the range. I always assume that every strong move on the open has about a 50% of leading to a swing and a 50% chance of being a trap and reversing.
A small gap up, like today, has a 75% chance of closing in the 1st hour. Today was one of those 25% days when it stayed open.
I was aware that Friday had a trading range and there was a magnet below the open. But on the open, I always assume that a successful move up or down is more like 50%. I am looking for confirmation of the move. Also, the market could have rallied for an hour and then returned to the trading range. I am much more focused on opening patterns on the open.