Emini breakout above March major lower high needs follow-through
I will update again at the end of the day.
Pre-Open market analysis
Yesterday was a strong bull trend day. Furthermore, the Emini finally broke above the March 13 major lower high, which I said was likely. However, it only closed only 1 tick above. The bulls need follow-through buying over the next several days to make traders believe that the breakout will be successful. In addition, they need to get 20 or more points above the high.
The bears will try to make the breakout fail. They need to get a strong reversal down for several days before the bulls will give up.
Since the Emini is still in the 6 month trading range, the odds are that the bulls will be disappointed over the next couple of weeks. Instead of a series of big bull bars, a tight trading range is more likely. For example, the Emini might oscillate around the March high for 2 – 3 weeks. Then, it would decide between trend resumption up to a new all-time high or trend reversal down.
Because yesterday was a buy climax, there is a 75% chance of at least a couple hours of sideways to down trading today that begins by the end of the 2nd hour. Although there is a 50% chance of follow-through buying on the open, there is only a 25% chance of another strong bull day.
Overnight Emini Globex trading
The Emini is down 2 points in the Globex session. If the day session opens here, it will continue yesterday’s 4 hour trading range. As strong as yesterday’s rally was, it stalled at major resistance.
While the odds favor a new all-time high before a break below the February low, trading ranges resist converting into trends. Therefore, the odds are that any strong rally or selloff will reverse rather than successfully breakout. That is true with the current rally as well. Therefore, the bears will sell any strong rally over the next week. They will try to create a sell signal bar on the daily chart, and then begin a reversal down. This means there is an increased risk of a series of bear days beginning within a couple of weeks.
Since yesterday was a buy climax, the odds are against a strong bull trend day today. More likely, yesterday’s 6 point trading range will continue. However, it will likely expand by a at least a measured move up or down today.
Yesterday’s setups
Here are several reasonable stop entry setups from yesterday. I sometimes also show limit order entries and entries on the close of bars. My goal with these charts is to present an Always In perspective. If a trader was trying to be Always In or nearly Always In a position all day, and he was not in a position at the moment, these entries would be logical times for him to enter.
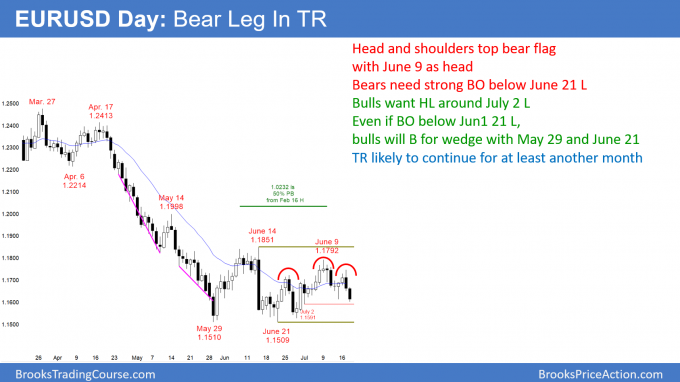
EURUSD Forex breakout below head and shoulders top bear flag, but probably just bear leg in trading range
The EURUSD daily Forex chart has consecutive big bear bars and a head and shoulders top bear flag. However, the May and June sell climaxes were extreme and now the chart is in a trading range at support. There should be buyers around the July 2 low and below the June 21 bottom of the trading range.
The EURUSD daily Forex chart is selling off from a small head and shoulders top bear flag. But, it is in a 2 month trading range and at major support on the weekly chart. Furthermore, the consecutive parabolic wedge sell climaxes and the June 14 sell climax were extreme. Finally, trading ranges resist converting into trends. Therefore, it is likely that the trading range will continue.
Since it would take about a month to test the June 14 sell climax high, the trading range has more to go. Traders are looking for a bottom. The bulls hope that this week will form a higher low and a double bottom with the July 2 low. If this selloff continues down to below the June 21 low, the bulls will buy the breakout. They will try to create a wedge bottom with the May 29 and June 21 lows.
The bears need a strong breakout below the June 21 low. That will require a big bear bar closing below that low, and then a follow-through bear bar. The odds are slightly better for a test of the June 14 high.
Overnight EURUSD Forex trading
Yesterday’s selloff continued overnight. But, it is now near the July 2 low of 1.1591, which is support. Therefore, the selling will probably end today around the overnight low, which is near the July 2 low. Because the 2 day bear channel is tight, the bulls will probably have to stop the selling and form a trading range before they can get a reversal up.
If this selloff is a resumption of the bear trend on the daily chart, it should not stop at the July 2 low. It should continue relentlessly far below the June 21 bottom of the trading range. Since that is unlikely, the odds are that the selling will stop today. The 5 minute chart should then reverse up at least 50 pips today or tomorrow if the bears are going to fail.
Summary of today’s S&P Emini futures price action and what to expect tomorrow
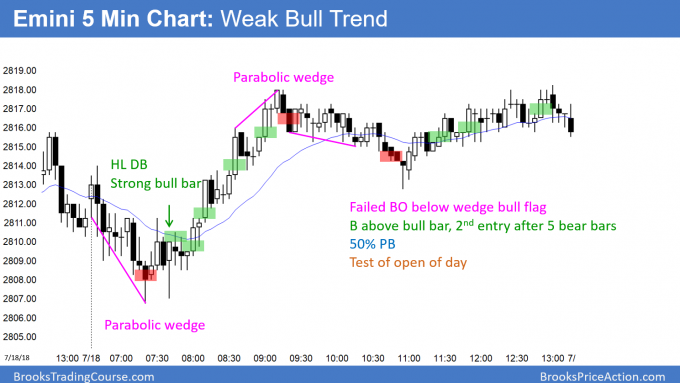
Here are several reasonable stop entry setups for today. I sometimes also show limit order entries and entries on the close of bars. My goal with these charts is to present an Always In perspective. If a trader was trying to be Always In or nearly Always In a position all day, and he was not in a position at the moment, these entries would be logical times for him to enter.
Today reversed up from an early brief selloff. It again closed above the March high. Because it had a bull body on the daily chart, is confirmed yesterday’s breakout. Yet, neither yesterday not today closed far above the March resistance. Therefore, there is still a 50% chance that the breakout will reverse down within a week or so. But, if it does, the odds are that the selloff will only be minor, and the bull trend will break to a new all-time high before yearend.
See the weekly update for a discussion of the price action on the weekly candlestick chart and for what to expect going into next week.
Traders can see the end of the day bar-by-bar price action report by signing up for free at BrooksPriceAction.com. I talk about the detailed S&P Emini futures price action real-time throughout the day in the BrooksPriceAction.com trading room. We offer a 2 day free trial.
When I mention time, it is USA Pacific Standard Time (the Emini day session opens at 6:30 am PST, and closes at 1:15 pm PST). You can read background information on the intraday market reports on the Intraday Market Update page.


