Emini and Forex Trading Update:
Monday August 31, 2020
I will update again at the end of the day.
Pre-Open market analysis
On Friday, the Emini closed above the 3500 Big Round Number for the 1st time. The daily chart is in a Small Pullback Bull Trend. The week before Labor Day has a bullish tendency. That reduces the chance that a big selloff will begin today. Even if there is a selloff, traders will probably buy the 1st 1 – 3 day pullback.
Five of the past 8 weeks gapped up on the weekly chart. While 3 of the gaps closed, the weekly trend is still strong. With the Emini currently up 5 points in the Globex session, this week might gap up as well.
Today is the final trading day in August. So far, August is a big bull bar closing at an all-time high on the monthly chart. The bulls want the month to close near the high. They then will try to get September to gap up on the monthly chart to get consecutive monthly gaps up.
Even though the bull trend has been strong, most days have had several hours of trading range price action. Day traders will expect more sideways trading again today. But because of the extreme buy climax, there is a slightly increased chance of a big trend day up or down.
There is now a streak of 7 consecutive bull bars on the daily chart. That is getting extreme. It therefore increases the chance of today closing below the open. Also, there was a streak of 9 consecutive bull bars that ended a couple weeks ago. The consecutive buy climaxes increase the chance of a 2 – 3 week selloff in September, and the Emini could fall at least 10%.
Overnight Emini Globex trading
The Emini is up 5 points in the Globex session. It therefore might form the 6th gap up on the weekly chart in the past 9 weeks. However, most small gaps close. For example, three of the prior 5 gaps up closed before the end of the week.
So far, the Globex session has a bear reversal. It rallied early and it sold off for the past 6 hours. It is now near the session’s low. This is a reversal bar on the Globex daily chart. But remember, the bulls have able to undo anything bearish for 2 months. They will therefore try to get today to close at least above the midpoint of the Globex range. This is especially true because they want September to gap up on the monthly day session chart tomorrow.
The daily chart is extremely overbought. Traders should expect at least a 10% correction to begin in September. It can start at any time. But betting that any one day in a Small Pullback Bull Trend will be the start of the selloff is a low probability bet.
With most days having a lot of trading range trading, that is what is most likely today. The bulls want a gap up on the monthly chart tomorrow. That reduces the chance of a big selloff today.
Friday’s setups

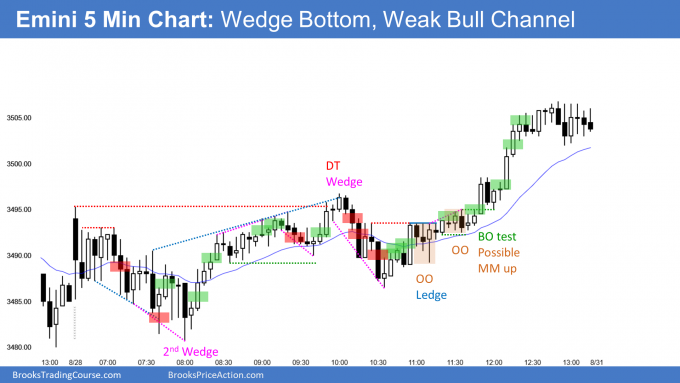
Here are several reasonable stop entry setups from Friday. I show each buy entry with a green rectangle and each sell entry with a red rectangle. I rarely also show limit order entries and entries on the close of bars. I do not want the lines to be distracting. If they are longer, I make them dotted. But, they have to be visible, so I make the shorter ones solid. Buyers of the Brooks Trading Course and Encyclopedia of Chart Patterns have access to a much more detailed explanation of the swing trades for each day (see Online Course/BTC Daily Setups).
My goal with these charts is to present an Always In perspective. If a trader was trying to be Always In or nearly Always In a position all day, and he was not currently in the market, these entries would be logical times for him to enter.
If the risk is too big for your account, you should wait for trades with less risk or trade an alternative market like the Micro Emini.
EURUSD Forex market trading strategies

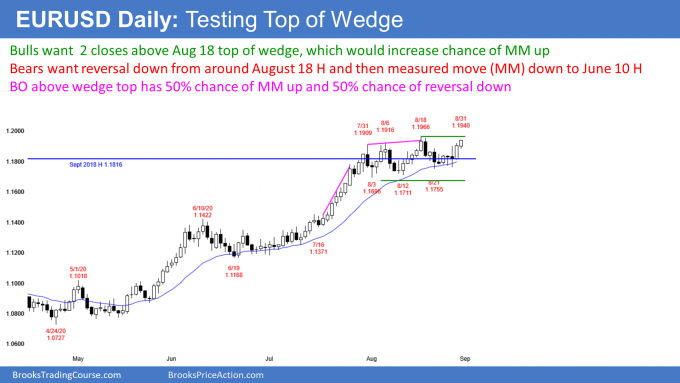
The EURUSD Forex market on the daily chart is testing the top of the August wedge. If the bulls break above the August 18 high, there will be a 50% chance of a measured move up. The probability will be higher if they get consecutive closes above that high. This is especially true if the closes are far above.
The bears want a breakout below the August trading range and then a test of the June 10 high. They know that even if the bulls get a breakout above the August 18 high, there is a 50% chance that it will fail and the EURUSD will then reverse down. A failed breakout above the wedge would also be a higher high double top.
Today is the final trading day in August. August has a bull body on the monthly chart. Since August is the follow-through bar after the July breakout, its bull body makes at least slightly higher prices likely in September. But the daily chart is more important this week.
Overnight EURUSD Forex trading
The 5 minute chart of the EURUSD Forex market is trading above last week’s high. It therefore has triggered a weekly High 1 bull flag buy signal.
While the EURUSD has rallied 50 pips over the past 4 hours, it has had several legs up and down overnight. A reversal from here would form an expanding triangle with the 2 earlier overnight highs.
Last week was a buy signal bar on the weekly chart. Today triggered the buy by going above last week’s high. However, the 4 hour rally is a Spike and Channel bull trend on the 5 minute chart. That typically evolves into a trading range. At the moment, day traders are only buying. But once there is a 20 – 30 pip pullback, they will sell as well.
Since a trading range is likely today, the bulls will soon switch to scalping. The EURUSD will probably be in a 30 pip range around last week’s high for the remainder of the session.
Can today continue up to above the August high? Yes, but the bars on the 5 minute chart are small and the channel should soon evolve into a trading range. The EURUSD will therefore probably not close at the high of the month.
Summary of today’s S&P Emini futures price action and what to expect tomorrow
I will post chart after the close.

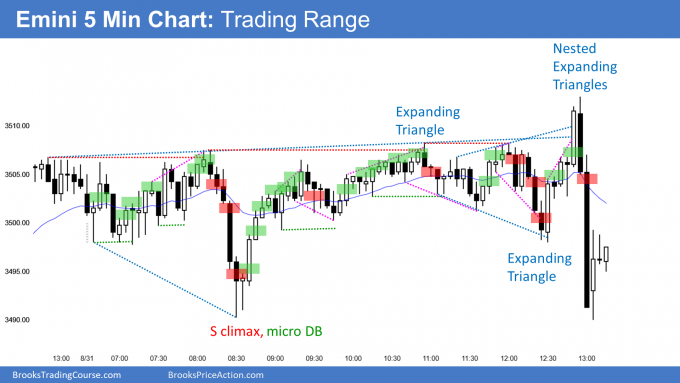
Here are several reasonable stop entry setups for today. I show each buy entry with a green rectangle and each sell entry with a red rectangle. I rarely also show limit order entries and entries on the close of bars. I do not want the lines to be distracting. If they are longer, I make them dotted. But, they have to be visible, so I make the shorter ones solid. Buyers of the Brooks Trading Course and Encyclopedia of Chart Patterns have access to a much more detailed explanation of the swing trades for each day (see Online Course/BTC Daily Setups).
My goal with these charts is to present an Always In perspective. If a trader was trying to be Always In or nearly Always In a position all day, and he was not currently in the market, these entries would be logical times for him to enter.
If the risk is too big for your account, you should wait for trades with less risk or trade an alternative market like the Micro Emini.
End of day summary
Today was another trading range day, even though it made a new all-time high. Today is the last day of the month. The bulls were hoping that the month would close near the high so that September could gap up on the monthly chart tomorrow, like August. But today’s let selloff makes that unlikely.
Since today had a bear bar, it ended the current streak of 7 consecutive bull days. There was a 9 day streak that ended a couple weeks ago. Streaks like this usually attract profit, which is likely in September. Traders should expect a 10% pullback to begin in September.
There is a small chance that September will be a 6th consecutive bull bull bar on the monthly chart. There is also a small chance that September will trade above the August high and then below the August low and form an outside down month.
See the weekly update for a discussion of the price action on the weekly chart and for what to expect going into next week.
Trading Room
Traders can see the end of the day bar-by-bar price action report by signing up for free at BrooksPriceAction.com. I talk about the detailed S&P Emini futures price action real-time throughout the day in the BrooksPriceAction.com trading room. We offer a 2 day free trial.
Charts use Pacific Standard Time
When I mention time, it is USA Pacific Standard Time (the Emini day session opens at 6:30 am PST, and closes at 1:15 pm PST). You can read background information on the intraday market reports on the Market Update page.
Al, is this true that trader’s price reaction has no connection with current macro economy state? Maybe I should say computers instead. The algo only looks at trend, channel, reversal etc. That’s why stock market is so disconnected with reality? thx
If you are at a hotel in NYC and have a shuttle take you to JFK, you will get to JFK. But who knows all the turns on the way?
The fundamentals control the big picture, which is 6 months or more. But technicals become increasingly important as you shorten the time frame. Any day or series of days can trend up or down regardless of what the weekly and monthly charts are doing.
Traders should ignore the fundamentals and just trade the technicals. Investors can ignore the technicals, but will get better entries if they look at technicals and buy on a pullback to support.
I admire your clear and wise answers. Honestly, we are fortunate to have the time, energy and wisdom of such a rare professional mentor. I can only imagine how many times you answered the same question, and still put in the energy to give us. This is highly appreciated, and wishing you all the best with some of that good giving karma, back to you, in your life. I am quite sure that, while this comment was lengthy and perhaps sentimental, I am quite sure that the appreciation part is shared by many others, most of them, as people are, silent. All the best, dear Al.
I second this!
Couldn’t have said it better!
I completely agree. To be honest, if I really write down how I feel towards Al it would come off as highly sycophantic. Al, you are a Gem of a person/professional/teacher and numerous times I have felt thankful that I found you…