Emini buy climax ahead of March FOMC announcement
I will update again at the end of the day.
Pre-Open market analysis
The 2 dominant forces today are the buy climax on the daily chart and the 11 am FOMC announcement. The daily chart has rallied in a bull micro channel for 8 days. That is unusual and therefore a buy climax. It is coming 3 months into a climactic rally.
Yesterday closed below its low and it is therefore a sell signal bar for today. Today will probably trigger the sell signal by trading below yesterday’s low. However, after 8 bars without a pullback, the 1st reversal down might be minor. It could last just a day or two. The bears might need a micro double top before they can begin a 1 – 2 week leg down.
The Emini has been in a trading range for 16 months. Consequently, the odds are that the breakout above the 2018 triple top at 2825 will fail. A failure does not mean a bear trend. It simply means a temporary end of the rally.
The momentum up has been strong. Therefore, the rally might continue for another week or two before there is at least a 3 week selloff to around the March 8 higher low.
FOMC announcement at 11 am PST
The FOMC is the other major force today. It is always a potential major catalyst for a big move up or down. Day traders should exit positions before the 11 am PST announcement and wait for at least 10 minutes after the report before trading again. Then, they should be open to anything.
Since the 60 minute chart has not touched its 20 bar EMA about 50 bars, the odds are that it will get there tomorrow. If it does not reach the target before the report, there will probably be a selloff after the report that gets there.
Overnight Emini Globex trading
The Emini is up 1 point in the Globex market. Yesterday’s bear trend reversal was exceptionally strong. It might dominate the price action for several days. Day traders should be aware that a lower high could lead to a big swing down. Therefore, if there are 2 – 3 consecutive bear bars, especially if they are big and close near their lows, day traders should try to swing part of their short position.
Day traders should trade normally until about 30 minutes ahead of the 11 am PST report. Then, they have to be careful, and they should exit positions before the report.
In addition, they should wait at least 10 minutes after the report before trading again. This is because there is typically a quick move in the wrong direction within the 1st few minutes. The Emini usually needs at least 10 minutes to establish a trend.
Yesterday’s setups

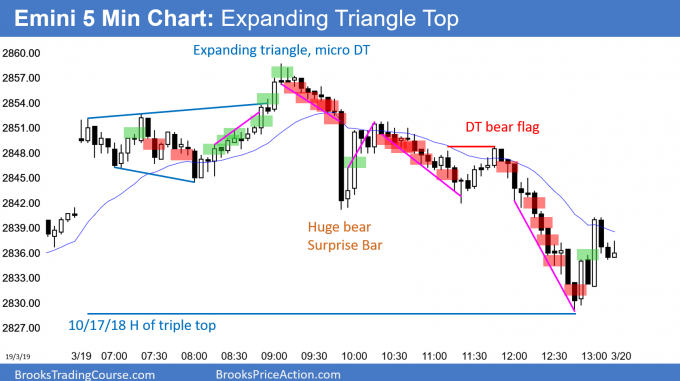
Here are several reasonable stop entry setups from yesterday. I show each buy entry with a green rectangle and each sell entry with a red rectangle. I rarely also show limit order entries and entries on the close of bars. My goal with these charts is to present an Always In perspective. If a trader was trying to be Always In or nearly Always In a position all day, and he was not currently in the market, these entries would be logical times for him to enter.
EURUSD Forex market trading strategies

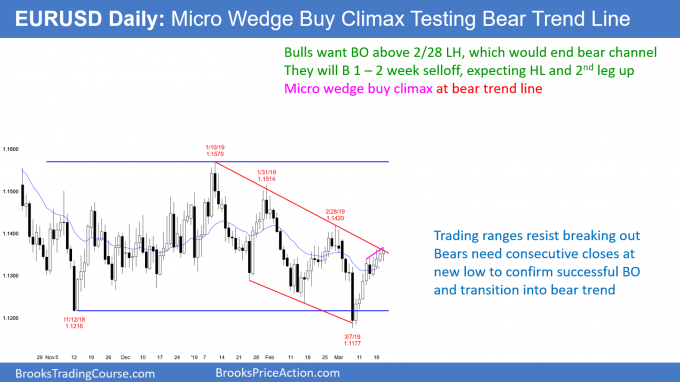
The EURUSD daily chart has rallied in a bull micro channel for 10 days. That is a sign of strong bulls. They typically will buy the 1st pullback below the prior day’s low.
There is a micro wedge at the bear trend line. That is a buy climax at resistance. While that usually would result in a 1 – 2 week selloff, the bears will probably need a micro double top 1st.
In addition, because the daily chart is in a trading range, low probability events have a higher probability of happening. The market often goes beyond support or resistance before reversing. The January 10 rally and the March 7 selloff are examples. Consequently, this rally might go above the February 28 lower high before there is a 1 – 2 week selloff.
The 2 week rally is strong and it followed a wedge bottom. When that is the case, the bulls usually will get a 2nd leg sideways to up after the 1st selloff. Therefore, if there is a 50% selloff to around 1.1350, it will probably reverse up from a higher low.
It is important to remember that there have been many strong legs up and down over the past 4 months. Each reversed after 2 – 3 weeks. There is no evidence that the pattern has ended.
Overnight EURUSD Forex trading
The EURUSD 5 minute Forex chart has rallied 30 pips over the past 4 hours. However, day traders have been making money selling above the prior day’s high for 5 days. That has created a micro wedge on the daily chart. The overnight rally is not strong enough to deter the bears from doing the same today.
Since the daily chart has rallied for 10 days, the bulls continue to buy 20 – 30 pip selloffs. Because the daily range has been small for 5 days, day traders have been scalping.
There is an FOMC announcement at 11 am PST today. Day traders should exit positions ahead of the report. In addition, they should wait for at least 10 minutes after the report before trading again. This is because there is usually a quick reversal within the 1st several minutes after the report. It usually takes at least 10 minutes for a trend to become clear.
Summary of today’s S&P Emini futures price action and what to expect tomorrow

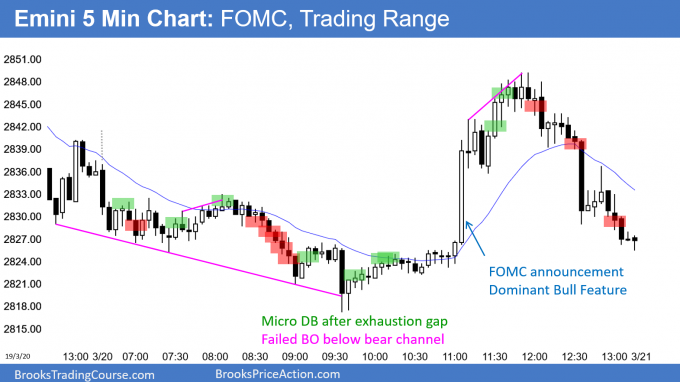
Here are several reasonable stop entry setups for today. I show each buy entry with a green rectangle and each sell entry with a red rectangle. I rarely also show limit order entries and entries on the close of bars. My goal with these charts is to present an Always In perspective. If a trader was trying to be Always In or nearly Always In a position all day, and he was not currently in the market, these entries would be logical times for him to enter.
End of day summary
The Emini reversed up on the FOMC report, but sold off to the middle of the range at the end of the day. Today was the 1st pullback after an 8 day bull micro channel. The odds were that traders would buy below yesterday’s low.
Today is now a High 1 bull flag and a buy signal bar for tomorrow. But, today was a bear doji day and therefore a weak buy signal bar. Also, since the daily and weekly charts are in buy climaxes, the upside is probably not very big over the next few days.
See the weekly update for a discussion of the price action on the weekly chart and for what to expect going into next week.
Trading Room
Traders can see the end of the day bar-by-bar price action report by signing up for free at BrooksPriceAction.com. I talk about the detailed S&P Emini futures price action real-time throughout the day in the BrooksPriceAction.com trading room. We offer a 2 day free trial.
Charts use Pacific Standard Time
When I mention time, it is USA Pacific Standard Time (the Emini day session opens at 6:30 am PST, and closes at 1:15 pm PST). You can read background information on the intraday market reports on the Intraday Market Update page.