Emini and Forex Trading Update:
Thursday November 7, 2019
I will update again at the end of the day.
Pre-Open market analysis
The Emini sold off early yesterday on China trade news, but the strong bull trends on the daily and weekly charts were more important. The day reversed up and it is a buy signal bar for today on the daily chart.
Traders expect a test of 3100. However, the rally is climactic. Therefore there will probably be a 1 – 2 week pullback soon. It might be underway already, but the Emini will more likely test 3100 first.
Since a gap up on the monthly chart is rare, the pullback will probably fall below the October high and close the gap. However, the bull trend is strong. Traders should expect higher prices after the Emini closes the gap.
Overnight Emini Globex trading
I said yesterday that yesterday would have a bull body on the daily chart and become a High 1 buy signal bar for today. I also said that there would probably be a test of 3100 before there is a 2 week pullback. The Emini is up 12 points in the Globex session. It will therefore probably gap above yesterday’s high. That will trigger the buy signal on the daily chart.
A big gap up increases the chance of a trend day. If there is a trend, up is more likely than down.
With so much trading range price action over the past few weeks, today will probably not form a strong trend. Traders should expect a lot of sideways trading even if today is a trend day.
However, the daily chart is in a buy climax and 3100 is a psychological barrier. Consequently, traders should expect a test down to the October high to begin within a week. The rally might go 20 points above 3000 before the pullback begins. But the probability is now shifting in favor of some profit taking after 4 strong weeks up.
A reasonable target would be a test of the October high of 3049. If there is a pullback, it will probably fall below that high and close the gap on the monthly chart. Traders will buy the pullback.
The yearlong rally and the rally of the past month make higher prices likely for at least the remainder of the year.
Yesterday’s setups

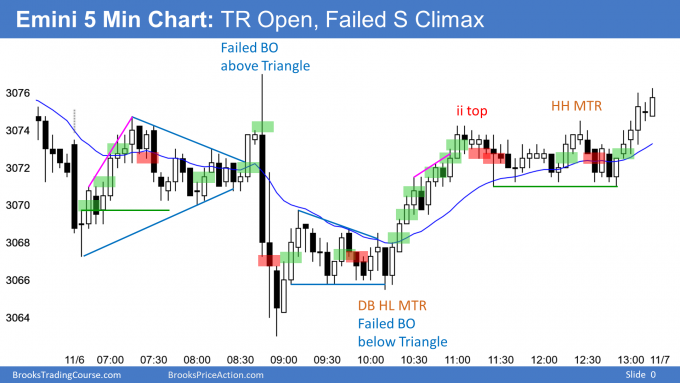
Here are several reasonable stop entry setups from yesterday. I show each buy entry with a green rectangle and each sell entry with a red rectangle. I rarely also show limit order entries and entries on the close of bars. Buyers of the Brooks Trading Course and Encyclopedia of Chart Patterns have access to a much more detailed explanation of the swing trades for each day.
My goal with these charts is to present an Always In perspective. If a trader was trying to be Always In or nearly Always In a position all day, and he was not currently in the market, these entries would be logical times for him to enter.
EURUSD Forex market trading strategies

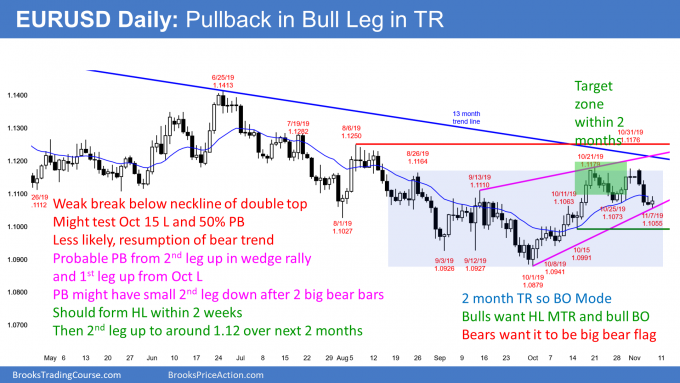
The EURUSD daily Forex chart broke below the neck line of a double top 2 days ago. But there has been no follow-through selling. This is consistent with the chart being in a 2 month trading range. Traders should expect disappointing follow-through and reversals instead of the start of a strong trend up or down.
Because the chart is in a trading range, the week-long selloff will probably have to test down more toward the middle of the range. A reasonable target is the October 15 low, which is around a 50% pullback from the October rally.
Since that rally was the strongest one on the daily chart in almost 2 years, traders should expect a 2nd leg up. Consequently, bulls will soon look to buy either around the current level or the October 15 low.
A trading range is a breakout mode pattern. There is always both a buy and sell setup. The bears see these 2 months as a big bear flag. They expect a bear breakout at some point. The lack of follow-through selling over the past 2 days is a sign that the current selloff is more likely just a bear leg in the range and not a resumption of the 22 month bear trend.
Overnight EURUSD Forex trading
Yesterday was a small trading range day. It was a Low 1 sell signal bar on the daily chart. Today traded below yesterday’s low and therefore triggered the sell signal.
Yet, the EURUSD soon reversed up. There were more buyers than sellers below yesterday’s low and below last week’s low. Today is therefore forming a micro double bottom with Tuesday’s low.
The bulls want today to close near its high. It would then be a buy signal bar on the daily chart. They would see a High 2 bull flag with the October 25 low. In addition, this would be a higher low major trend reversal.
While they might get a resumption of the October rally from here, the 2 day selloff was surprisingly strong. Consequently, there is confusion. That typically results in more sideways trading. Traders should expect a 50 pip trading range that will last today and tomorrow. Day traders will scalp for 10 – 20 pips unless there is a strong breakout up or down on the 5 minute chart.
Summary of today’s S&P Emini futures price action and what to expect tomorrow

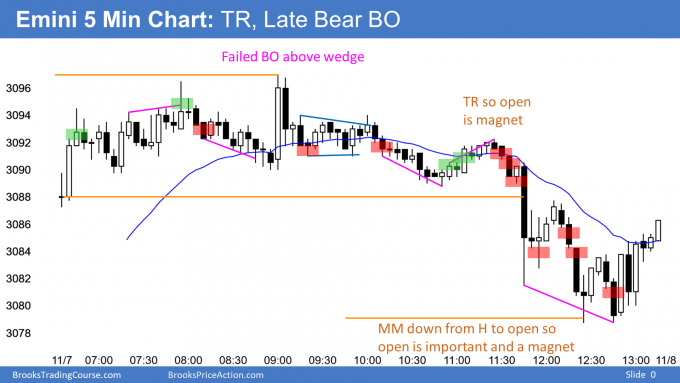
Here are several reasonable stop entry setups for today. I show each buy entry with a green rectangle and each sell entry with a red rectangle. I rarely also show limit order entries and entries on the close of bars. Buyers of the Brooks Trading Course and Encyclopedia of Chart Patterns have access to a much more detailed explanation of the swing trades for each day.
My goal with these charts is to present an Always In perspective. If a trader was trying to be Always In or nearly Always In a position all day, and he was not currently in the market, these entries would be logical times for him to enter.
End of day summary
After a big gap up, the Emini entered a tight trading range. There was a late bear breakout and today closed near its low.
Today is a sell signal bar for tomorrow. There are consecutive parabolic wedge tops in the 5 week rally. Also, the Emini is testing the 3100 Big Round Number. Consequently, there will probably be a pullback to between 3000 and 3050 that begins within a week or so.
Will today be the top? It might be, but many bulls will wait to take profits until after the Emini breaks above 3100 or until the Emini begins to accelerate down.
The upside over the next week is small. But, even if the bears get their 2 week pullback, the bulls will buy it, expecting another new high before the end of the year.
See the weekly update for a discussion of the price action on the weekly chart and for what to expect going into next week.
Trading Room
Traders can see the end of the day bar-by-bar price action report by signing up for free at BrooksPriceAction.com. I talk about the detailed S&P Emini futures price action real-time throughout the day in the BrooksPriceAction.com trading room. We offer a 2 day free trial.
Charts use Pacific Standard Time
When I mention time, it is USA Pacific Standard Time (the Emini day session opens at 6:30 am PST, and closes at 1:15 pm PST). You can read background information on the intraday market reports on the Market Update page.
Hi Al,
what was the reason for not selling below bear bar 7?
Market tried to get back to 7 low on bar 14 low (could not) and eventually touched it with bar 24,
which immediately followed buying. This is showing market paid attention to it.
thx
Hi JH,
Answering for Al who is in Las Vegas for his TradersEXPO workshops.
Al’s analysis on his other site at BrooksPriceAction.com was that market was still possibly Always In Long, and bar 7 was in a Tight Trading Range, so weak sell. Wait.
Swings are always weak set ups 40%.
And there are many entries within TTR marked on Al slides, just look at bar 43
What about a bear case?
Market failed to BO 2 times with price being far above MA.
So, thanks for the obvious answer, but it did not help.
Al obviously had a bull bias at the time. You had a bear bias which was equally fine.
As Al often says we can buy or sell at any time, and as long as we manage it Ok, we can make money or get out breakeven. In your case, the swing paid off at end of day but an awful long time to wait.
Sorry for the obvious answer! I was just saying what Al had written on his Daily Update. 😉
To be honest, I did not have bear bias at that time, because of daily bull signal bar and 3100 big round number.
We do not discuss here buys and sells at any time.
We discuss here specific PA context supported by patterns like in this case 2nd failed BO with price far above MA.
I wrote “obvious”, because what I wrote and you wrote can be learned within few months, but in order to be right 95% of time in market direction, which Al presents with these slides, you need far more knowledge than calling DT/DB.
Besides are you 100% sure we would be having this discussion if bar 7 sold off to MA?
Hi Al,
Reference the EUR/USD, would you not expect a test of the Oct low, considering the break above the bear trend line starting from 25/6 to it being broken around the 10-11 Oct, would you not expect a test of the Oct low, then bouncing back up? Considering the Monthly and weekly charts are still very much bearish?
kind regards
Simon
I am planning to talk about this in this weekend’s update.