Emini and Forex Trading Update:
Friday February 26, 2021
I will update again at the end of the day.
Pre-Open market analysis
The Emini sold off yesterday to below Wednesday’s low, totally erasing that rally. Traders are still deciding whether the Emini will close below month midpoint today, and in early stages of a 10% correction, or in a bull flag. One day looks good for the bulls, and then next is good for the bears.
But if today is a 2nd consecutive big bear day, it would be the 1st time this has happened since the 10% selloffs in September and in October. It would make it likely that the Emini will fall about 10% within a few weeks.
If today gaps down and the gap stays open, there would be a month-long island top with the February 2 gap up. Traders would look for a measured move down to around 3,600.
Today is the last day of the week and the last trading day of February, and therefore weekly and monthly support and resistance can be important, especially in the final hour.
On the weekly chart, the bears want the week to close below the open. There would then be a bear body, which would increase the chance of sideways to down trading next week.
The bulls want the month to close above the January high and above the midpoint of the month. That would increase the chance of sideways to up trading in March. But if February closes below the midpoint of the month, traders would expect sideways to down trading in March.
The last day of the week, and of the month, tends to have bigger and faster moves, especially at the end of the day. With the Emini finishing yesterday around the weekly and monthly magnets, it might trade sideways today until the end of the day, and then decide on a bullish or bearish close.
Overnight Emini Globex trading
The Emini is up 11 points in the Globex session. It will therefore open around a cluster of magnets, which include the midpoint of February, the low of the week, the weekly and daily bull trend lines, the 50-day MA, and Wednesday’s low. That increases the chance of a trading range.
Also, yesterday was a sell climax. The day after a sell climax has a 75% chance of at least a couple hours of sideways to up trading starting by the end of the 2nd hour.
But even if today is a trading range day, the range yesterday was very big. The legs today should be big enough for at least one swing trade up or down.
Because of the importance of consecutive big bear days, if the Emini has begun a 10% correction, today could be a 2nd big bear day. But every big bear day since the end of October was followed by a bull day. Therefore, the bulls will bet that today will close above the open. However, even though the other bear days were followed by bull days, most of the bull days were small. That reduces the chance of a big bull day today.
Since today is the final day of the week and of the month, there is an increased chance of a big move in either direction at the end of the day.
Yesterday’s setups

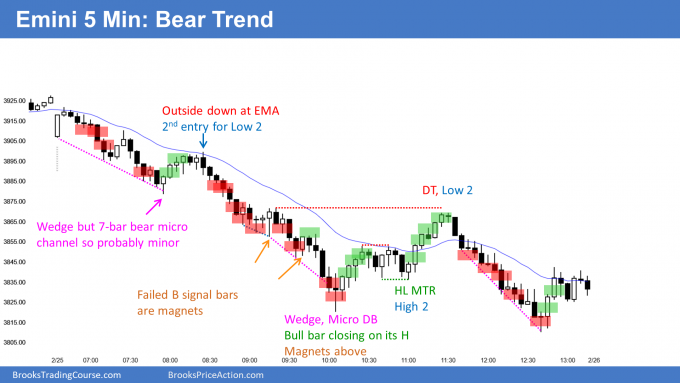
Here are several reasonable stop entry setups from yesterday. I show each buy entry with a green rectangle and each sell entry with a red rectangle. Buyers of both the Brooks Trading Course and Encyclopedia of Chart Patterns have access to a much more detailed explanation of the swing trades for each day (see Online Course/BTC Daily Setups).
My goal with these charts is to present an Always In perspective. If a trader was trying to be Always In or nearly Always In a position all day, and he was not currently in the market, these entries would be logical times for him to enter.
If the risk is too big for your account, you should wait for trades with less risk or trade an alternative market like the Micro Emini.
EURUSD Forex market trading strategies

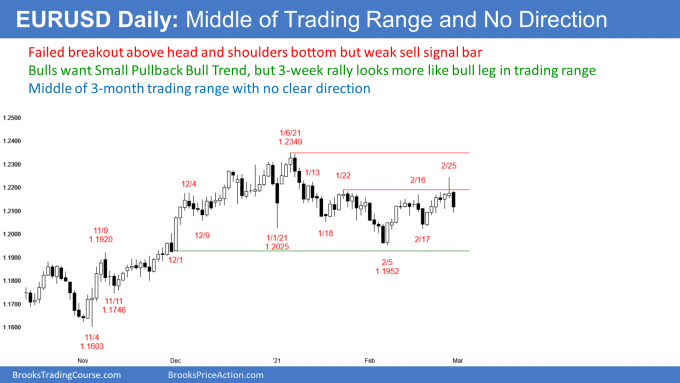
The EURUSD Forex market on the daily chart lacks direction. It broke above a head and shoulders bottom yesterday, but reversed down. Today triggered a Low 2 sell signal, and a sell signal for a lower high major trend reversal, but the past 2 days had bull bodies. There is a lack of conviction. Also, the EURUSD is in the middle of a 3-month trading range.
There is no sense of urgency. Traders feel that the price is just above right. They continue to look for reversals and take quick profits.
Today is the final trading day of the week, and the bar on the weekly chart is trading near the open of the week. That is neutral.
It is neutral as well on the monthly chart. Today is also the final trading day of February, and the EURUSD is back at the open of the month. Traders will wait for March to see if one side or the other gains control.
Overnight EURUSD Forex trading
The 5-minute chart of the EURUSD Forex market has been continuing its reversal down from yesterday’s high. Day traders have only been selling.
However, today’s range is now about average. That reduces the incentive for the bears to sell at the low, and hope for much lower prices. Therefore, the selling will probably soon stop. Once there is a 20-pip bounce, day traders will also begin to buy for scalps. If the bulls can convert the bear trend into a trading range for a couple hours, they will have a 40% chance of getting a trend reversal up.
At the moment, it is still better to only to look to sell, but this will probably change in the next couple of hours since a trading range is likely soon.
Summary of today’s S&P Emini futures price action and what to expect tomorrow

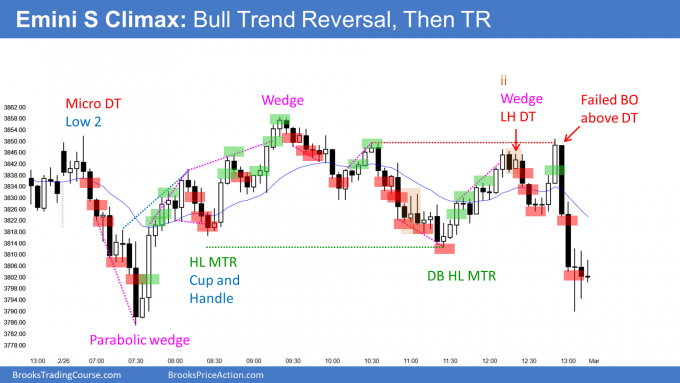
Here are several reasonable stop entry setups for today. I show each buy entry with a green rectangle and each sell entry with a red rectangle. Buyers of both the Brooks Trading Course and Encyclopedia of Chart Patterns have access to a much more detailed explanation of the swing trades for each day (see Online Course/BTC Daily Setups).
My goal with these charts is to present an Always In perspective. If a trader was trying to be Always In or nearly Always In a position all day, and he was not currently in the market, these entries would be logical times for him to enter.
If the risk is too big for your account, you should wait for trades with less risk or trade an alternative market like the Micro Emini.
End of day summary
The Emini sold off on the open but reversed up strongly from just above the bottom of the February 2 gap. There was a wedge bottom where the 1st 2 legs formed yesterday. After a strong reversal up to a new high, the Emini entered a trading range. The late selloff resulted in a close far below the open.
It is very significant that today was a bear bar on the daily chart. I have been saying for several months that the bulls formed a bull day after every big bear day since late October. I kept saying that the odds favored higher prices until there was a big bear day followed by a 2nd strong bear bar on the daily chart. Today was that day. Traders should expect a 10% correction over the next few weeks. The bulls need consecutive strong bull bars on the daily chart to reverse this selloff.
See the weekly update for a discussion of the price action on the weekly chart and for what to expect going into next week.
Trading Room
Traders can see the end of the day bar-by-bar price action report by signing up for free at BrooksPriceAction.com. I talk about the detailed S&P Emini futures price action real-time throughout the day in the BrooksPriceAction.com trading room. We offer a 2 day free trial.
Charts use Pacific Standard Time
When I mention time, it is USA Pacific Standard Time (the Emini day session opens at 6:30 am PST, and closes at 1:15 pm PST). You can read background information on the intraday market reports on the Market Update page.
The monthly chart for NAS100 looks even weaker than that of S&P500. NAS100 has longer tail on top. Does it imply that the outlook of ~10% correction for Nasdaq is also likely?
NAS100 is now at about the beginning of 2021 level. Is this level any type of sentimental support?
Thanks,
-Shafiq
The Nasdaq is highly correlated with the Emini. If one goes down, both go down. Unfortunately, I am already doing all that I can handle and cannot add the analysis of other markets.