Emini daily bull flag but in weekly buy climax
I will update again at the end of the day.
Pre-Open market analysis
I was in Orlando on Thursday and Friday last week and therefore do not have Friday’s chart in today’s update.
Friday was a bull reversal bar after a 3 day pullback. It is therefore a High 1 buy signal bar for today. If today gaps up, the daily chart will have a 2 day island bottom. But, island tops and bottoms are minor patterns. They therefore have little predictive value.
There is a problem with this High 1 bull flag. The daily and weekly charts have buy climaxes. Consequently, there will probably be sellers above Friday’s high and above last week’s high.
Weekly chart has a weak sell signal bar
I said last week that the week would probably close below the open of the week. This would create a bear body on the weekly chart.
Instead, there was a buy climax at the end of the day and the week closed just above the open. This is important because now the weekly chart has 8 consecutive weeks with bull bodies. That is extremely rare. Just look back over the past 20 years to see what I mean. I did a quick check and did not see any prior examples. Consequently, this is unsustainable and climactic.
The doji close makes last week a weak sell signal bar for this week. But, the 8 week bull channel has been tight. Therefore, the reversal down will probably be minor.
Daily chart had 10 consecutive bear days in December so sell climax
The current weekly buy climax is similar to December sell climax on the daily chart. I discussed that selloff many times in late December. December 24 was the 10th consecutive bear day. I said that the stock market never had 10 consecutive bear days, and that therefore the selloff was an extreme sell climax.
Early the next day, I said in the chat room that I bought calls. I wrote that the reversal up from an extreme climax would likely be strong enough to make traders believe the bull trend had resumed. That has been the case over the past 7 weeks.
Weekly chart has 7 consecutive bull bodies so buy climax
The current situation in similar to that daily sell climax, but now there is a buy climax and it is on the weekly chart. Last week in the chat room, I said that I bought puts, expecting at least a 2- 3 week selloff.
While the momentum up over the past 7 weeks is enough to continue up to the October – December triple top around 2,800, the weekly buy climax is telling us that there is a 60% chance of at least a 2 – 3 week pullback first. The selloff could last longer. An obvious magnet is the close of 2017, which has been an important price since then. The Emini continues to oscillate around it, and it has been unable to break free of that magnet.
What’s coming over next few months?
Of all of the things that can happen over the next few months, the most likely is a continuation of the yearlong trading range. Trading ranges commonly have legs up and down that subdivide into 2 – 3 smaller legs.
The 7 week rally is probably the end or near the end of the 1st leg up. Traders should expect at least a few weeks sideways to down beginning within the next few weeks. The selloff could last a couple of months and test 2,500, although that is currently unlikely.
Since the 7 week rally has been exceptionally strong, there will be many bulls looking to buy a pullback. They hope that the selloff retraces above half of the rally. But, with the rally as strong as it has been, the selloff will probably hold above a 50% pullback.
Finally, there will probably be a rally up to the 2,800 triple top in March, April, or May. At that point, traders will find out if the bull trend has resumed or the trading range will continue. The bulls need a strong break above 2,800. Without that, the yearlong trading range will continue. Since trading ranges resist breaking out, a continuation of the range for many more months is most likely.
Overnight Emini Globex trading
The Emini is up 9 points in the Globex session. If it gaps up today, it will form a 2 day island bottom. However, because the daily chart is in a parabolic wedge bull channel, it will likely begin to enter a trading range. Therefore, there will probably be sellers somewhere above Friday’s high and last week’s high.
This reduces the chances of a big bull trend day today, despite a gap up. Consequently, the gap up might lead to a trading range or even a selloff today.
The weekly chart will probably have a bear body this week. As a result, traders will sell any rally into the middle of the week, expecting Friday to close below today’s open.
The selloff could begin with a failed gap up today. Even if it does, the odds are against a strong bear trend this week. After 7 consecutive bull bars on the weekly chart, the Emini will probably have to go sideways for a week or more before the bears can create a strong leg down. This uncertainty increases the chance of trading range price action early this week.
EURUSD Forex market trading strategies

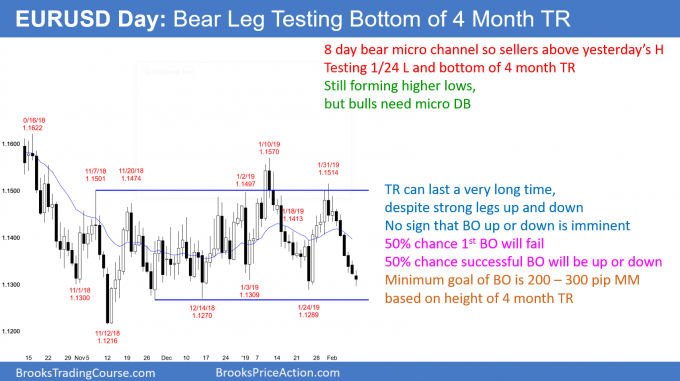
The EURUSD daily Forex chart has had many strong legs up and down in its 4 month trading range. Today is the 8th day in a selloff . When there is a bear micro channel lasting 6 or more days, the bulls typically need a micro double bottom before they can create a bull leg. Consequently, there will be sellers above the prior day’s high.
This is because a micro double bottom needs a 2nd bottom. Therefore, even though this selloff is strong, it is no different from any of the many other strong legs up or down over the past 4 months. When there has been a micro channel, the market needed a test before a reversal.
Protracted trading range means bigger breakout
Every trading range for the past several years has broken out after about 2 months. This one has lasted longer. When a trading range lasts a long time, the breakout typically goes for more than a measured move. Depending on how a trader views this trading range, its height is around 200 – 300 pips. As a result, a successful breakout will probably run at least 300 pips.
However, until there is a breakout, there is no breakout. Consequently, the odds are that this selloff will reverse up over the next week. But, with a breakout likely imminent, traders need to be ready for a relentless trend beginning soon.
Overnight EURUSD Forex trading
The EURUSD 60 minute chart has sold off in a tight bear channel for 6 days. The 1st reversal up is usually minor. However, because the chart is now at the bottom of a 4 month trading range, the bears will probably take some profits. If they do, the tight bear channel will convert into a trading range for at least a couple days.
That is likely here. Therefore, day traders will look for reversals on the 5 minute chart. Since the overnight range has only been 30 pips, day traders are scalping for 10 pips. Because the upcoming 2 day trading range will be at least 50 pips tall, the bulls will look for a bottom on the 5 minute chart, hoping for a 30 – 50 pip rally.
But, the bears will sell above yesterday’s high. They have been so eager to sell for 8 days that they have been selling below the prior day’s high. They will most likely be very happy to have the opportunity to sell above a prior day’s high.
Summary of today’s S&P Emini futures price action and what to expect tomorrow

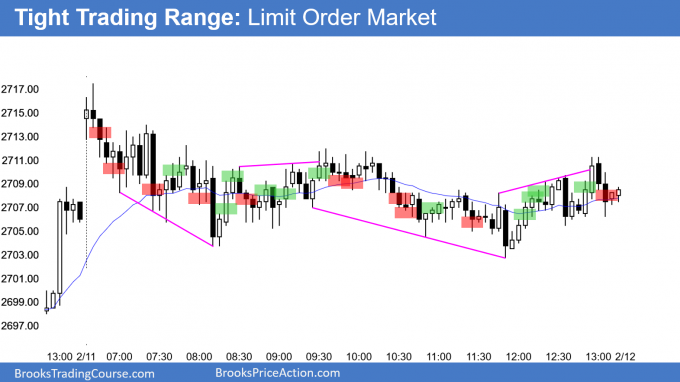
Here are several reasonable stop entry setups for today. I show each buy entry with a green rectangle and each sell entry with a red rectangle. I rarely also show limit order entries and entries on the close of bars. My goal with these charts is to present an Always In perspective. If a trader was trying to be Always In or nearly Always In a position all day, and he was not currently in the market, these entries would be logical times for him to enter.
End of day summary
After closing the gap above Friday’s high, the Emini entered a tight trading range today. Day traders mostly scalped with limit orders. That increases the chance of another trading range day tomorrow.
The odds favor 2 – 3 weeks of sideways to down trading starting this week. This week will probably close below today’s open to create a bear bar on the weekly chart.
See the weekly update for a discussion of the price action on the weekly chart and for what to expect going into next week.
Trading Room
Traders can see the end of the day bar-by-bar price action report by signing up for free at BrooksPriceAction.com. I talk about the detailed S&P Emini futures price action real-time throughout the day in the BrooksPriceAction.com trading room. We offer a 2 day free trial.
Charts use Pacific Standard Time
When I mention time, it is USA Pacific Standard Time (the Emini day session opens at 6:30 am PST, and closes at 1:15 pm PST). You can read background information on the intraday market reports on the Intraday Market Update page.
As always, thank you Al for all the time you put in to help out. I was able to attend the event in Orlando and it was great, (if he is ever in your town i recommend you make sure to check it out).
I just had a question about options and I understand if you don’t want to share any of this info, however i’m in a position where I have to trade with options to keep my risk low enough. When you buy calls or puts how do you choose which ones to buy? How far in the money, expiration date?
Also do you ever trade options for your normal daytrade entries? I find it easy to enter the weeklys for daytades but exiting is really hard.
If there is a video anywhere that explains this I haven’t found it.
I have a draft of an options course, but I don’t know if I ever will complete it.
I almost always trade at the money options. If I am planning to exit within a day or two, I will buy options that expire within a few weeks, and rarely even the next or same day. In general, if I might hold for 2 or more weeks, I want to buy about 2 months out.
If there is unusually huge moves intraday, I sometime will day trade options instead of the Emini. This is almost always buying calls in a big sell climax down to support.