Emini daily bull flag after weekly wedge top
I will update again at the end of the day.
Pre-Open market analysis
Yesterday was a small trading range day. Since Tuesday was a bull day that reversed up from the 20 day EMA, it was a buy signal bar on the daily chart. When yesterday went above Tuesday’s high, it triggered the buy signal. However, since the Emini has sold off for 5 days, yesterday is a pullback in a bear trend. It is therefore a minor sell signal bar for today. But, it is a doji and it followed a big bull bar. Therefore it is a weak sell signal, and there are probably more buyers than sellers below its low.
The weekly chart is still on a weak sell signal. The two day reversal has been strong enough to generate confusion. Confusion usually leads to a trading range. Therefore, the odds are against a big move up or down today.
Because last week’s range was small, the bulls have a 40% chance of going above last week’s high. Since it reversed up from below last week’s low, this week would then be an outside up week. That is a sign of strength. But, the resistance of the March high is just above. Until the bulls break above it, there is no breakout. Therefore, the 5 month trading range is still in effect.
Overnight Emini Globex trading
The Emini is down 3 points in the Globex market. Today will probably trade below yesterday’s low. That would trigger a sell signal on the daily chart.
There will likely be more buyers than sellers below yesterday’s low since it is a weak sell signal. Furthermore, yesterday was a small day. Therefore, a reversal up from below yesterday’s low would have a 30% chance of continuing to above yesterday’s high. Today would then be an outside up day, which is a sign of buying pressure.
With most days being mostly sideways, the odds are that today will have a lot of trading range trading again.
Yesterday’s setups
Here are several reasonable stop entry setups from yesterday. I sometimes also show limit order entries and entries on the close of bars.
EURUSD Forex market trading strategies
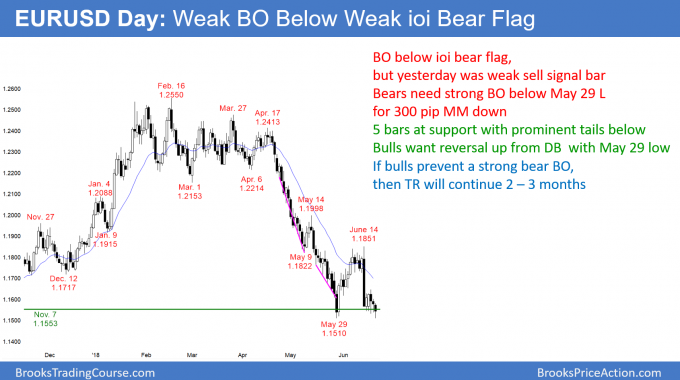
The EURUSD daily Forex chart broke below yesterday’s low. But, yesterday was a bear doji in a tight trading range, and the past 4 days had prominent tails below. This is a weak ioi bear flag. An ioi is an inside bar after an outside bar. The outside bar means that the bar before is inside of the outside bar.
The EURUSD daily Forex chart is in a strong bear trend. However, it is also in the early stages of a trading range. It is looking for the bottom of the range.
The bulls hope that this week’s low will be the bottom. But, they need a strong bull bar today or tomorrow for a buy signal bar. They would then have a High 2 bottom with Monday’s bull bar. That would be a reasonable bottom because it would be a 2nd reversal up from below the May low. In addition, the daily chart is at the support of the November 7 low.
While yesterday was a bear inside day, it was a doji bar. Therefore, it is a weak sell signal bar. Yet, if the bulls cannot create bull bars today or tomorrow, the odds favor at least slightly lower prices.
The minimum goal for the bears is a 100 point measured move down based on the height of the 4 day bear flag. They have a 40% chance of a 300 pip measured move down based on a failed double bottom attempt. There is a 60% chance of at least a 200 pip rally before the daily chart falls more than 100 pips below the May 29 low.
Overnight EURUSD Forex trading
The EURUSD 5 minute Forex chart reversed up 40 pips after breaking below yesterday’s low. However, the bulls need a continuation of the rally. Without that, the rally will be a bull leg in a trading range rather than the start of a swing up.
The 240 minute chart is forming a wedge bottom over the past 5 days. Therefore, the bulls will look for a strong rally and a test of the top of the wedge today or tomorrow. That is just above 1.1700.
Summary of today’s S&P Emini futures price action and what to expect tomorrow
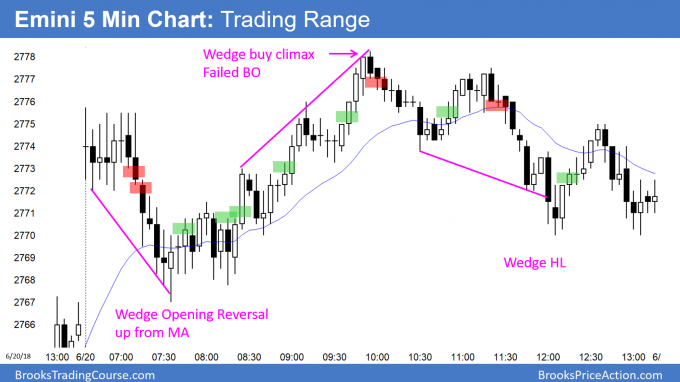
The Emini sold off on the open. After a 4 hour trading range, the bears got trend resumption down. However, the bulls again reversed up from just above the May 22 high.
After a sell climax on the open, the bulls got a trading range. But, the bears then got trend resumption down. Yet, they were unable to break below the May 22 high. The bulls got a 2nd reversal up from that support at the end of the day.
The bears need a break far below the May 22 high. They then would look for a test of the next higher low, which is the May 29 low.
Tomorrow is Friday and this week’s open and last week’s low are the most important weekly magnets for tomorrow.
See the weekly update for a discussion of the price action on the weekly candlestick chart and for what to expect going into next week.
Traders can see the end of the day bar-by-bar price action report by signing up for free at BrooksPriceAction.com. I talk about the detailed S&P Emini futures price action real-time throughout the day in the BrooksPriceAction.com trading room. We offer a 2 day free trial.
When I mention time, it is USA Pacific Standard Time (the Emini day session opens at 6:30 am PST, and closes at 1:15 pm PST). You can read background information on the intraday market reports on the Intraday Market Update page.


thanks Al
Hi Al,
Can you explain your second sell signal today? the first is a L1. What is the second. Thanks
Early in a bear breakout, it is reasonable to sell below the low of a strong bear bar. If a trader was flat before that breakout and he likes trading Always In, he would have to sell below that bear bar to get short. That is the only reasonable choice for an Always In trader.