Emini daily buy signal bar and weekly sell signal bar at March high
I will update again at the end of the day.
Pre-Open market analysis
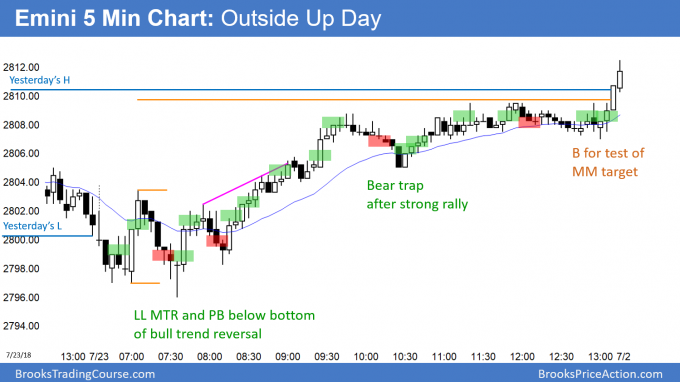
Yesterday, the Emini reversed up from below Friday’s low and the 2800 Big Round Number. It rallied to above Friday’s high and formed an outside up day. This is a sign of strong bulls.
The bulls need to continue to get bull bars if this rally is going to make a new all-time high. There is no top yet so at least slightly higher prices are likely.
But, there is a potential higher high double top with the March high. If the bears can get a reversal down from between here and 2850, they will try to test down to the middle of the 6 month trading range.
The chart is still in the resistance zone around the March high. The further above it this rally goes, the more likely the March high will become support and the rally will continue up to 3,000 – 3,200. The bears need to get a reversal soon because the bulls are taking control.
Overnight Emini Globex trading
The Emini is up 10 points in the Globex market. It will therefore likely gap up on the open. A big gap means an increased chance of a trend day, especially in the direction of the gap.
However, a big gap up means that the Emini will be far above the 20 bar EMA. Most traders are hesitant to buy too far above the average price unless there is an early rally that is much stronger than average. As a result, most big gap opens go mostly sideways for the 1st hour until the price gets closer to the average. At that point, the bulls will look for a double bottom or a wedge bottom. They will then try to create a bull trend day.
The best case for the bears is a series of 3 – 4 big bear trend bars on the open. If they get that, they would have a 50% chance of a bear trend day. Alternatively, if there is an early trading range, they will try to create a major trend reversal. If there is an early strong rally, they will look for a parabolic wedge top.
Since the majority of the bars during the past 10 days were mostly sideways, that is likely again today.
Yesterday’s setups
Here are several reasonable stop entry setups from yesterday. I sometimes also show limit order entries and entries on the close of bars. My goal with these charts is to present an Always In perspective. If a trader was trying to be Always In or nearly Always In a position all day, and he was not in a position at the moment, these entries would be logical times for him to enter.
EURUSD Forex Triangle at support after parabolic wedge sell climaxes
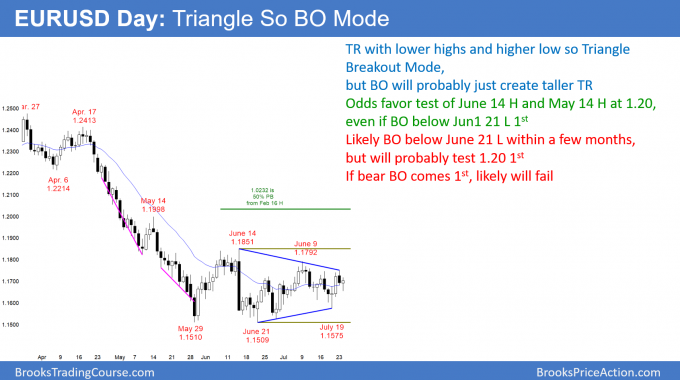
The EURUSD daily Forex chart is at the apex of a triangle. Since the June 14 sell climax high has not been tested yet, the odds slightly favor higher prices over the next few weeks.
The EURUSD daily Forex chart has been forming higher lows and lower highs for a couple of months. This is triangle and therefore a breakout mode pattern. But, because the June 14 sell climax high is a high probability magnet, the odds slightly favor the bulls. Furthermore, May 14 came within 2 pips of the 1.20 Big Round Number, which was not tested again. That is also a magnet.
Because the May collapse stopped at support on the weekly chart, it was a sell vacuum test of support. When that happens, there is usually a bounce that lasts a lot of bars and retraces about half of the selloff. Consequently, the odds favor a test of 1.20 within a few months. However, there might be a brief breakout below the triangle first.
The daily chart pulled back 100 pips from a 2 day rally. If the bulls can close today above the open, today will be a buy signal bar for tomorrow. Because the chart is at the apex of the triangle, the legs up and down are lasting only a few days. This usually is a sign that a breakout will come withing a couple of weeks.
Overnight EURUSD Forex trading
The EURUSD 5 minute Forex chart bounced 60 pips overnight. This is a 2 day pullback from last week’s rally. But, the 2 day selloff was sharp, creating a Big Up, Big Down pattern. This creates confusion, which usually means a trading range. Therefore, the rest of today will probably stay within a 50 pip range.
The key price is 1.1692. That is the open. The bulls want today to close above the open, which would create a bull bar on the daily chart. Today would then be a buy signal bar for tomorrow. They therefore will buy selloffs below that price today.
Since the bears always want the opposite, they will sell 10 – 20 pips above that price.
The price will probably be a magnet today, and today might oscillate around it. Then, in the final hour, traders will decide if today will close a little above it or below it.
Any day can be a trend day. But, the odds favor a trading range day and a close around the open.
Summary of today’s S&P Emini futures price action and what to expect tomorrow
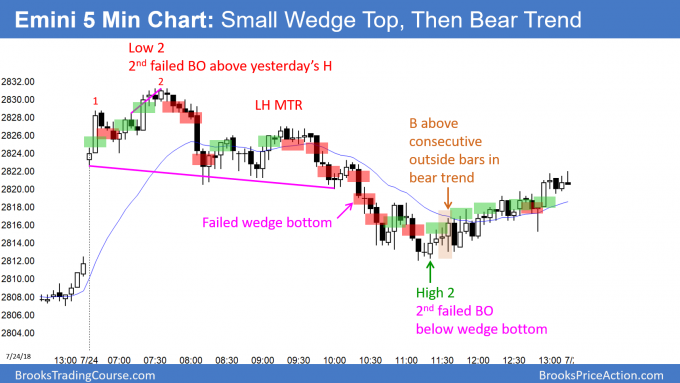
Here are several reasonable stop entry setups for today. I sometimes also show limit order entries and entries on the close of bars. My goal with these charts is to present an Always In perspective. If a trader was trying to be Always In or nearly Always In a position all day, and he was not in a position at the moment, these entries would be logical times for him to enter.
After gapping up, the Emini sold off today and closed the gap. It is a sell signal bar for tomorrow. Because it has a big tail below, it is a weak sell signal bar. In addition, since the 4 week rally is in a tight bull channel, the reversal down could be minor.
The location on the daily chart is good for the bears. They want a failed breakout of the March high and a test down to the June higher low below 2700. But, they need follow-through selling over the next few days. Otherwise, the Emini will stay sideways around 2800 .
See the weekly update for a discussion of the price action on the weekly candlestick chart and for what to expect going into next week.
Traders can see the end of the day bar-by-bar price action report by signing up for free at BrooksPriceAction.com. I talk about the detailed S&P Emini futures price action real-time throughout the day in the BrooksPriceAction.com trading room. We offer a 2 day free trial.
When I mention time, it is USA Pacific Standard Time (the Emini day session opens at 6:30 am PST, and closes at 1:15 pm PST). You can read background information on the intraday market reports on the Intraday Market Update page.


