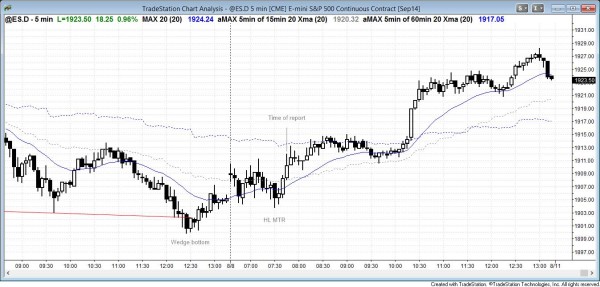
I posted this chart after the close. The Emini had a higher low major trend reversal after yesterday’s 4 day wedge bottom at key support levels. The breakout to a new high at 7:40 set the tone and was likely to remain the dominant feature for at least a couple of hours for day trading. The bull trend began to resume up at 10:10 and then had a very strong bull breakout that tested the open of the week. That price controlled the price action right to the close of the day. The bears wanted a bear body on the weekly chart as follow-through from last week’s bear breakout, and the bulls wanted a reversal up from the weekly moving average and for the bear breakout attempt to fail. Although the candle on the weekly chart was a doji, it had a 1 tick bull body. This means that the bulls won, but barely. They were able to deny the bears any follow-though from last week’s bear breakout. However, a doji is a weak buy signal bar and, next week, there will probably be sellers above this week’s high. The S&P will probably be sideways for a week or two, but the odds still favor a second leg down after a brief pullback up.
Posted 7:45 am PST.
The most important price action in today’s intraday update is the bull breakout from the opening trading range after yesterday’s wedge bottom and today’s higher low major trend reversal. Bulls will buy pullbacks and expect a second leg up. Because of the trading range open and the market still being below yesterday’s lower high and the 60 minute moving average, there might be a deep pullback. However, the odds favor a second leg up. Bears see this as an expanding triangle top and hope for another failed breakout, but the odds favor the bulls after the 5 day wedge bottom at many support areas.
I added this at 8:30 am.
Despite the major trend reversal and wedge bottom on the Emini 5 minute chart, the weekly bar closes today and there are magnets nearby. These include 1900, the open of the week, last week’s low and close, and the moving average. Today’s close determines the appearance of the weekly bar. The bears want signs of strength so that traders will be willing to short, expecting lower prices over the next few weeks. The bears want today’s close, and therefore the weekly close, to be below all of those prices. They would like the week to be a big bear bar closing on its low.
The bulls want the opposite and want the week to be a big bull candle, making traders believe that last week’s selloff was just a pullback. This will encourage other traders to buy and it could lead to another leg up.
See the weekly update for a discussion of the weekly chart.
Traders can see the end of the day bar-by-bar price action report by signing up for free at BrooksPriceAction.com. I talk about the detailed Emini price action real-time throughout the day in the BrooksPriceAction.com trading room, and a 2 day free trial is available.
When I mention time, it is USA Pacific Standard Time (the Emini day session opens at 6:30 am PST, and closes at 1:15 pm PST). You can read background information on the intraday market reports on the Intraday Market Update page.