Emini and Forex Trading Update:
Friday October 2, 2020
I will update again at the end of the day.
Pre-Open market analysis
The Emini futures is testing resistance around the September 16 lower high and the 3400 Big Round Number. It is trying to hold above the February high and the 50-day MA.
It is more likely that the Emini will turn down from this area than break strongly above it. However, there is still room to those targets above so the Emini will probably go at least a little higher.
Today is Friday and this week is the entry bar for a High 2 bull flag on the weekly chart. The bulls want the week to close on its high. This week would then be a strong entry bar and it would make at least slightly higher prices next week.
President Trump tested positive for Covid-19 today. No one knows if he will get sick or how the market will respond if he does. However, the technical factors are still in control. The market already believes that Biden will probably win. Therefore, if the President has to stop campaigning, that would probably not affect the market.
Overnight Emini Globex trading
The Emini is down 52 points in the Globex session on the news of Trump testing positive for Covid-19. It sold off on the news but then has been sideways for 7 hours.
The location on the daily chart is good for the bears. I have been saying that the Emini would test to around the September 16 high and 3400 and then work its way down to below the September low.
The uncertainty has been over when the reversal down will begin. The news about the President could be the catalyst. If the bears get a couple consecutive big bear days, traders will conclude that a 2nd leg down has begun. If today is sideways to up, traders will look for a test closer to the September 16 high.
The market has had many big, abrupt reversals over the past couple days. That increases the chance of a big move in either direction. With the overnight news, there is less chance of a big bull trend day. If there is going to be a strong trend day, down is more likely, both because of the news and the pattern on the daily chart.
Big gap down increases the chance of a trading range open
The Emini will open with a big gap down. That increases the chance of a trading range open. While it is bearish, traders do not like to sell too far below the average price. The 20-bar EMA on the 5-minute chart is one measure of average. Most of the time, the Emini goes sideways after a big gap until it gets closer to the EMA. Since I use a 20-bar EMA, it can take about 20 bars to get there.
In a trading range open, the bulls look to buy either a wedge bottom or double bottom. The bears want to sell a wedge top or double top near the EMA. After a big gap down, there is only a 20% chance of a strong trend up or down that starts on the open.
Yesterday’s setups

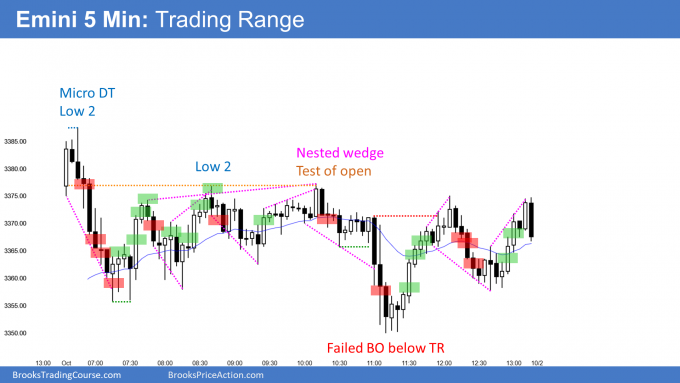
Here are several reasonable stop entry setups from yesterday. I show each buy entry with a green rectangle and each sell entry with a red rectangle. I rarely also show limit order entries and entries on the close of bars. I do not want the lines to be distracting. If they are longer, I make them dotted. But, they have to be visible, so I make the shorter ones solid. Buyers of both the Brooks Trading Course and Encyclopedia of Chart Patterns have access to a much more detailed explanation of the swing trades for each day (see Online Course/BTC Daily Setups).
My goal with these charts is to present an Always In perspective. If a trader was trying to be Always In or nearly Always In a position all day, and he was not currently in the market, these entries would be logical times for him to enter.
If the risk is too big for your account, you should wait for trades with less risk or trade an alternative market like the Micro Emini.
EURUSD Forex market trading strategies

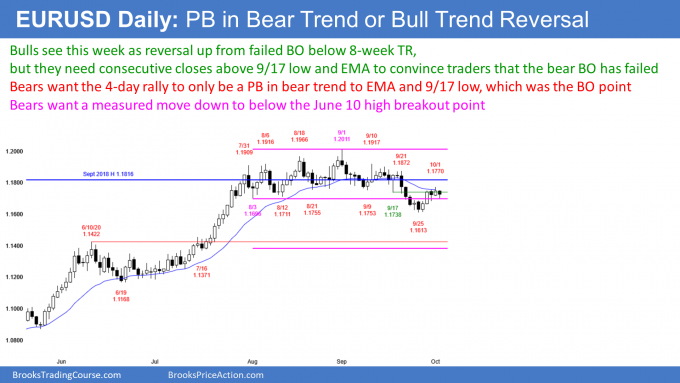
The EURUSD Forex market on the daily chart has had 2 small legs up from the low this week. There is already a wedge bear channel that began with the small bull bar on September 24. But if this rally is just a bear flag and a test of resistance at the EMA and September 17 low, there might be one more small bull day left in the next couple days.
If today or Monday is a big bull day that closes near its high and far above the September 17 low, traders will conclude that last week’s bear breakout failed. The EURUSD would be back its 2-month trading range. For traders to conclude that the July bull trend is resuming, they will need a strong break above the September 1 high.
For 2 months, the bars have been small, the legs up and down have lasted only a week or so, and many bars have had prominent tails. This is trading range price action, which reduces the chance of a big breakout in either direction. Traders continue to look for reversals. They exit in a few days and then look for another another trade in either direction.
This week is a bull bar on the weekly chart. The bulls want the week to close near the high of the week, which is yesterday’s high. If it does, that will increase the chance that last week’s bear breakout failed, and it would increase the chance of higher prices next week. If this week has a big tail on top, which it currently has (not shown), traders will look for more sideways trading next week.
Overnight EURUSD Forex trading
The 5-minute chart of the EURUSD Forex market traded below yesterday’s low, but reversed up. Yesterday was a Low 1 sell signal bar on the daily chart, but it had a bull body. Traders expected that there would be more buyers than sellers below its low.
The reversal up was not particularly strong and the EURUSD has been in a 40-pip tall trading range for most of the session. The trading range is currently a triangle. Day traders are buying reversals up from the low and selling reversals down from the high, and they are scalping.
The 2 bull overnight legs were stronger than the bear legs. That reduces the chance of a bear trend day.
The fight today will be over the close. The bears want today to close near its low and below yesterday’s low. That will increase the chance of lower prices next week. The bulls want the day and week to close near its high. That will increase the chance of higher prices next week.
Summary of today’s S&P Emini futures price action and what to expect tomorrow
I will post chart after the close.

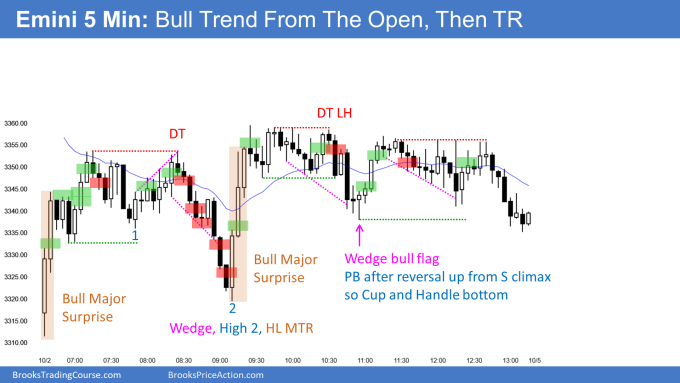
Here are several reasonable stop entry setups for today. I show each buy entry with a green rectangle and each sell entry with a red rectangle. I rarely also show limit order entries and entries on the close of bars. I do not want the lines to be distracting. If they are longer, I make them dotted. But, they have to be visible, so I make the shorter ones solid. Buyers of both the Brooks Trading Course and Encyclopedia of Chart Patterns have access to a much more detailed explanation of the swing trades for each day (see Online Course/BTC Daily Setups).
My goal with these charts is to present an Always In perspective. If a trader was trying to be Always In or nearly Always In a position all day, and he was not currently in the market, these entries would be logical times for him to enter.
If the risk is too big for your account, you should wait for trades with less risk or trade an alternative market like the Micro Emini.
End of day summary
After a big gap down on the open, the Emini fell briefly below last week’s high, closing this week’s gap up. The Emini reversed up strongly, but failed at the EMA and the 60 minute EMA.
The bears got a reversal down, but the bulls bought it. There was a 2nd strong reversal up, this time from a higher low major trend reversal to a new high of the day. The market entered at trading range just below the February high, which has been a magnet for 2 months.
Traders expect a break below the September low in October, but there might be a test of the September 16 lower high first.
See the weekly update for a discussion of the price action on the weekly chart and for what to expect going into next week.
Trading Room
Traders can see the end of the day bar-by-bar price action report by signing up for free at BrooksPriceAction.com. I talk about the detailed S&P Emini futures price action real-time throughout the day in the BrooksPriceAction.com trading room. We offer a 2 day free trial.
Charts use Pacific Standard Time
When I mention time, it is USA Pacific Standard Time (the Emini day session opens at 6:30 am PST, and closes at 1:15 pm PST). You can read background information on the intraday market reports on the Market Update page.
Emini 10/2:
-Why do we sell the 7:10 bar but not the much stronger bar at 7:35, which creates an additional DT?
-Why do we sell the 8:55 bar but not the one that follows?
-If we sell 10:25, why don’t we sell 9:45 and 9:55? Doesn’t the same logic apply (DT LH), but with better signal bars?
Dear Al.. would you look back to the 1965-1975 expanding triangle.. isn’t it similar to where we are now.. just that the time it took to go up and down is months now, versus multi years in the past..
Same pattern. Expanding triangles can be any size. With 5 strong bull bars on the monthly chart, the bears will probably need a micro double top before they can get a trend reversal. The bulls will buy the first 1 – 2 bar (month) pullback.
Alright got it.. thanks Al..
Anyway, I have been a solid follower of your teachings.. modelling, learning and deeply understanding your methods for the last 6 years. In fact, my trading turned around because of learning and implementing what I learned from you.
I have been writing reports privately for my consulting clients, and just recently decided to publish the reports publicly as a personal challenge for me – just putting myself out there.
For your own amusement, if you want to read it, you can at palmanalysis.com/. It covers mainly the crude palm oil market, but also soybeans, soybean oil as they are complementary markets, and also currencies such as the dollar index.
The language and terms I used are mostly modeled after you, because that’s what I’m literally doing for my technical aspects of my trading decisions.
But as I have found, especially the commodities market, using what I have learned from you, and combining it with the fundamentals (supply, demand, production, weather) and global macro factors such as crude oil, the currencies and taking these factors together overall gives a better picture of the road ahead..
Anyway.. for your own amusement.. if you want to see what a dedicated follower to your methods is like..
And thanks for all that you have done thus far..