Emini gap up ahead of Wednesday’s FOMC announcement
I will update again at the end of the day.
Pre-Open market analysis
Yesterday gapped up to another all-time high and was a strong bull trend day in a bull trend. But, whenever there is a gap up, there is often a gap down. The gap down can be on the next day or several weeks later. That would create an island top. If there is no gap down, there is often a pullback that closes the gap, like after the gaps of August 27 and September 13. Even if yesterday’s gap closes, a gap closure or an island top is only a minor reversal. The odds still favor higher prices.
Since next Wednesday is an FOMC day, the Emini might begin to go sideways. In addition, after a big gap up above major resistance, the Emini usually goes sideways for a few days. Therefore, even though the odds favor higher prices, the bulls might not get much follow-through buying until after the FOMC announcement.
Overnight Emini Globex trading
The Emini is up 1 point in the Globex market. The bulls are hoping that the weak September rally is now strong. They therefore want confirmation of yesterday’s breakout. Their minimum goal is to create a bull body on the daily chart today. That would increase the chance of higher prices next week.
Since yesterday was a buy climax, the bulls are probably exhausted. That increases the likelihood of a trading range day today. If so, there will be a fight in the final hour over whether the close will be above or below the open. In the final hour, the bulls will buy if the Emini is below the open and the bears will sell if it is above. Since yesterday was a strong bull day in a bull trend on the daily and weekly charts, the bulls will probably have a bull close today.
There is a 20% chance of a strong trend day up or down. If the bears get a strong bear trend day, yesterday’s breakout will fail. Their minimum goal is a close below the open. However, they need a reasonable size bear body closing on its low on the daily chart. If they get that today, which is unlikely, today would be a good sell signal bar on the daily chart. More likely, today will either be a trading range day or a weak bull trend day.
Yesterday’s setups
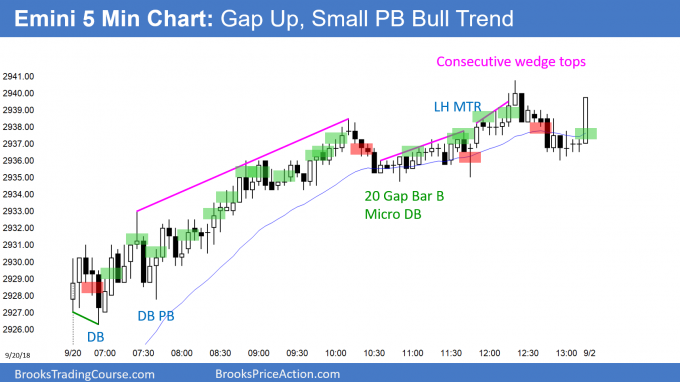
Here are several reasonable stop entry setups from yesterday. I sometimes also show limit order entries and entries on the close of bars. My goal with these charts is to present an Always In perspective. If a trader was trying to be Always In or nearly Always In a position all day, and he was not in a position at the moment, these entries would be logical times for him to enter.
EURUSD Forex parabolic wedge rally above July 9 high
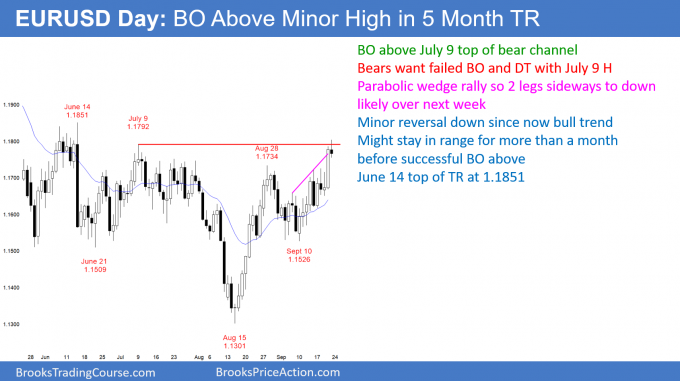
The EURUSD daily Forex chart achieved the initial goal of the bulls by breaking above the July 9 high. Since the rally is a parabolic wedge, a 2 legged pullback is likely over the next week.
The EURUSD daily chart had a parabolic wedge rally to above resistance. Therefore, the odds favor a pullback for the next week. However, the bears might need a micro double top over the next few days before they get their 200 – 300 pip pullback.
Since a pullback is likely, day traders will sell rallies. Because the daily chart is in a bull trend, they will buy selloffs. Finally, the daily chart is still in a trading range and the month-long rally has probably ended. Therefore the odds favor smaller days and more trading range trading over the next week. As a result, most day trades will be 10 – 30 pips. The market is also likely to get quiet ahead of Wednesday’s FOMC announcement.
Overnight EURUSD Forex trading
The EURUSD daily Forex chart achieved its major goal of rallying above the July 9 high. There was a spike down on June 14 and then a pullback to the July 9 high. This led to a parabolic channel down to August 15. Typically, there is a rally back to the top of the channel, which is the July 9 high. Then, the chart enters a trading range. So far, this is unfolding in the usual way.
Because the September rally has 3 legs in a tight channel, it is a parabolic wedge buy climax. The odds favor a couple legs down that will retrace 50 – 100% of the rally from September 10.
Since the daily chart is now in a bull trend, the rally will likely continue above the June 14 high at the top of the trading range. However, it might stay in the range for a month or more before the successful breakout.
There is a 30% chance that the bears will get a double top with the July 9 high and then a break below the August 15 neck line.
Summary of today’s S&P Emini futures price action and what to expect tomorrow
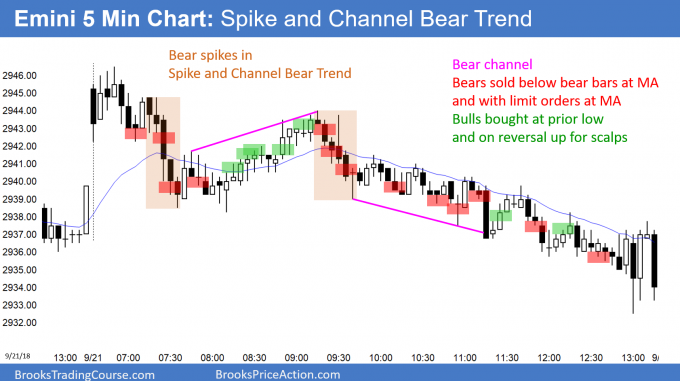
Here are several reasonable stop entry setups for today. I sometimes also show limit order entries and entries on the close of bars. My goal with these charts is to present an Always In perspective. If a trader was trying to be Always In or nearly Always In a position all day, and he was not in a position at the moment, these entries would be logical times for him to enter.
The Emini sold off from the open in a relentless Spike and Channel Bear Trend. Since today was a bear day on the daily chart, it provided no confirmation of yesterday’s bull breakout. Furthermore, it is a sell signal bar on the daily chart for next week for a failed breakout above the August high.
The bulls need a bull bar early next week to make traders believe that the rally will continue up to 3000. If next week sells off, like after Wednesday’s FOMC announcement, next week would be a sell signal bar on the weekly chart. That would probably lead to a 2 – 3 week selloff down to the 20 week EMA.
See the weekly update for a discussion of the price action on the weekly candlestick chart and for what to expect going into next week.
Trading Room
Traders can see the end of the day bar-by-bar price action report by signing up for free at BrooksPriceAction.com. I talk about the detailed S&P Emini futures price action real-time throughout the day in the BrooksPriceAction.com trading room. We offer a 2 day free trial.
Charts use Pacific Standard Time
When I mention time, it is USA Pacific Standard Time (the Emini day session opens at 6:30 am PST, and closes at 1:15 pm PST). You can read background information on the intraday market reports on the Intraday Market Update page.


You said you did not buy above 32 because, even though it was a Small PB bull channel, it was high in the trading range. Is it usually the case that on TR days location is more important than the nature of the trend?
Trading ranges always look like they are breaking into trends. Rallies get vacuumed quickly to the top, but reverse down, and selloffs accelerate near the low and reverse up.
Unless a rally within the range looks like a clear strong breakout, the odds are that it will reverse, and therefore buying with a stop at the top of a bull flag is a losing strategy.