Emini and Forex Trading Update:
Friday April 12, 2019
I will update again at the end of the day.
Pre-Open market analysis
The Emini tested 2900 again yesterday, and reversed down in the middle of the day. I have been saying that the bulls would probably get a breakout above 2900 this week. Today will probably gap above that Big Round Number.
If the bulls can get the day to close near its high, the odds will favor higher prices over the next few weeks. The next resistance is the 2956.00 all-time high.
I have been writing all week that the appearance of this week’s candlestick would be important. Today is Friday and its close determines how this week will look. The bears had been hoping for a close below the open of the week. Now, they will hope for a close back below the 2900 resistance.
The bulls had 2 big bull trend bars on the weekly chart over the past 2 weeks. I have been saying that those 2 bars created a breakout above a credible top from 3 weeks ago. I said that the odds favored at least a a couple small legs up over the next few weeks. If this week’s candlestick is a bull body closing near its high, the probability of higher prices over the next few weeks will be 60%.
Overnight Emini Globex trading
The Emini is up 18 points in the Globex session. The day session will probably have a big gap up above the 2900 Big Round Number. Whenever there is a big gap up, there is an increased chance of a trend day. If there is a trend, a bull trend is more likely.
Today’s open is especially important. Most days over the past 2 weeks had trading range opens. If today has several consecutive trend bars up or down, the odds of a trend day will go up.
A big gap increases the chance of a trend
When a gap up is big, the Emini is far above the EMA. That means far above the average price. The bulls do not want to pay an above average price unless the price action is above average. They need to see bull bars closing near their highs.
While a trend day is more likely today, there is only about a 30% chance of a big trend from the 1st bar. More often, the bulls prefer to buy closer to the average price. There is therefore a 70% chance of a trading range in the 1st hour, even if the 1st few bars are up. The bulls will look to buy a double bottom or wedge pullback to around the EMA. They then will look for a swing up.
The bears want the breakout to fail. While they can get a reversal down from the 1st bar, they usually need a double top or wedge top.
I want to make this clear. Bear day traders will look for either a double top or wedge top and then a bear trend day. Bull day traders want a double bottom or wedge bottom near the EMA and a bull trend day. A bull trend is more likely than a bear trend. There is only a 30% chance of a strong bull or bear trend from the open.
Yesterday’s setups

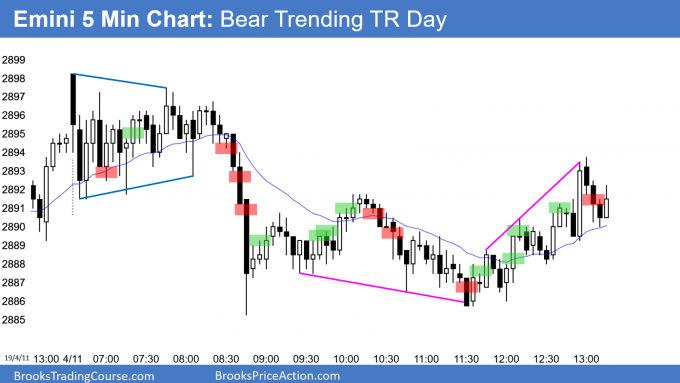
Here are several reasonable stop entry setups from yesterday. I show each buy entry with a green rectangle and each sell entry with a red rectangle. I rarely also show limit order entries and entries on the close of bars. My goal with these charts is to present an Always In perspective. If a trader was trying to be Always In or nearly Always In a position all day, and he was not currently in the market, these entries would be logical times for him to enter.
EURUSD Forex market trading strategies

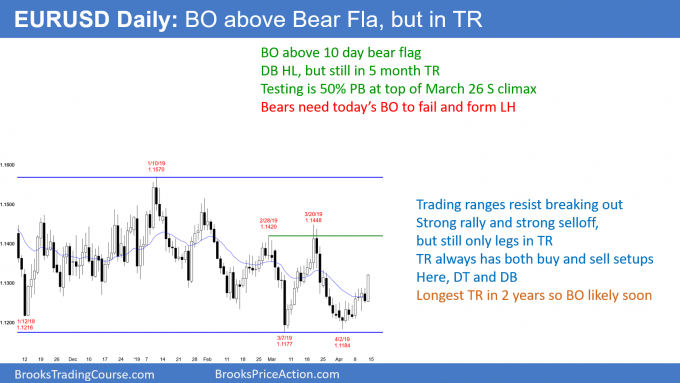
The EURUSD daily Forex chart had a weak rally for 10 days. It was a bear flag at the EMA. Today so far is a big bull trend day breaking above the bear flag. The bulls hope that it is the start of a test up to the top of the 5 month trading range.
If today closes near the high of the day, traders will see it as a successful breakout. In general, a bull breakout above a bear flag has a 60% chance of at least 2 small legs up to around a measured move. That would result in a test of the top of the 5 month range.
Whenever there is a breakout, traders pay attention to the next few bars. For example, even if today closes near its high, the bulls will want at least a small bull day tomorrow. If they get it, the probability that the breakout will continue to succeed would remain at 60%.
However, if the bears get a small bear body Monday, the probability will drop to close to about 55%. If Monday closes on its low and has a relatively big bear body, then the probability of a failed breakout would be about 50%.
This means that there will be a fight today over the close and another fight Monday over the open. The bulls want today to close near its high and Monday to close above its open. The bears always want the opposite.
Overnight EURUSD Forex trading
The EURUSD 5 minute Forex chart rallied 50 pips early in the European session. It has been in a 20 pip rang for the past 3 hours. The bulls have already accomplished their initial goal of breaking above the 10 day bear flag.
All they need for the rest of the day is to try to get the day to close near its high. Having the range grow from here does not significantly improve the odds of higher prices next week. Consequently, the bulls will buy 10 – 20 pip selloffs today. Since all they need is a close near the high, bull day traders will take profits around the high of the day. Swing traders will hold for about a 100 pip measured move up over the next week.
The bears failed to resume their bear trend from the March 20 high. They need to show traders that they can regain control. They probably cannot reverse the breakout today. Therefore, the best bear day traders can hope to get today are 10 pip scalps.
However, the bears would like the bar on the daily chart to be a weaker bull bar. At a minimum, they would like a conspicuous tail on top. They therefore will sell rallies, hoping to get the day to close at least 20 – 30 pips below today’s high. It would weaken the bull breakout further if the close was below yesterday’s high.
Summary of today’s S&P Emini futures price action and what to expect tomorrow

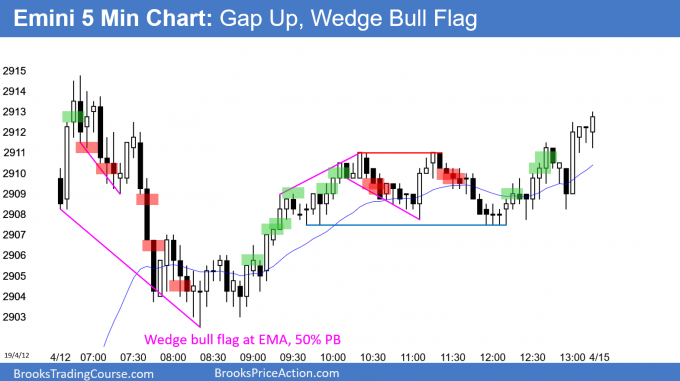
Here are several reasonable stop entry setups for today. I show each buy entry with a green rectangle and each sell entry with a red rectangle. I rarely also show limit order entries and entries on the close of bars. My goal with these charts is to present an Always In perspective. If a trader was trying to be Always In or nearly Always In a position all day, and he was not currently in the market, these entries would be logical times for him to enter.
End of day summary
After a big gap up above the 2900 resistance level, the Emini reversed down and then up. It was a trading range day. The bulls want follow-through buying next week. That would increase the chance of a new all-time high over the next month.
The bears, however, want a reversal down from the wedge top of the past month. But, without a strong reversal down, the odds continue to favor a test of the all-time high.
See the weekly update for a discussion of the price action on the weekly chart and for what to expect going into next week.
Trading Room
Traders can see the end of the day bar-by-bar price action report by signing up for free at BrooksPriceAction.com. I talk about the detailed S&P Emini futures price action real-time throughout the day in the BrooksPriceAction.com trading room. We offer a 2 day free trial.
Charts use Pacific Standard Time
When I mention time, it is USA Pacific Standard Time (the Emini day session opens at 6:30 am PST, and closes at 1:15 pm PST). You can read background information on the intraday market reports on the Intraday Market Update page.
When I see your EOD charts stop entries analysis above, I see a lot of contradictions with your live analysis on
http://www.brookspriceaction.com/viewtopic.php?t=4763
I don’t know if the analysis above are done live or at the EOD but would it be possible to have more consistency between both analysis?
Thanks!
Best regards.
I understand how you feel Pstoto because I used to feel the same exact way. However what I realized was I had a lack of understanding with what Al was saying. The more I studied and looked at his videos I began to realize more and more of what he means. Look at all the stop entries he marked today, they all represent “reasonable” always in trades. Remember most stop entries are minor and only 40% lead to decent swings, the other 60% of those trades lead to small winners or small losers (Minor Reversals).
Hope this helps
That is right. In the room, I tend to talk about scalps much more than swing trades, and there are many more scalps than swing trades. Scalps require high probability. Most swing trades are low probability. On these charts, I am highlighting reasonable swing entries. Most of them are not high enough probability for scalping.
I understand, but still, nothing prevent you from giving swing indications (I am not saying entries just “indications”) in your room, indications that will be consistent with your EOD chart above. The problem is that you choose to be obscure on your performance: as a result if your are not perfectly coherent on your analysis that will feed supicions.