Emini giving back all of 2018 gains on test of 2700
I will update again at the end of the day.
Pre-Open market analysis
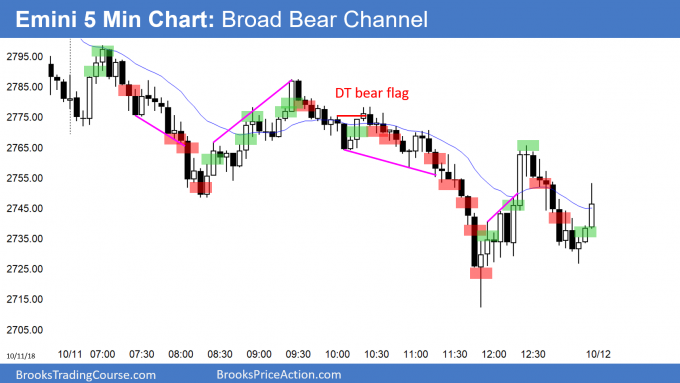
Since yesterday was another big bear day on the daily chart, the Emini will probably test the next major support at 2700 within a few weeks. Look at the 1st half of the year. What was the most important price? It was last year’s close at 2689.75. I say that because the Emini repeated oscillated around it for 6 months. After 2 strong down days, lower prices are likely. But, because the selling was climactic, the odds favor a bounce for a week or two.
Note, last year’s close is within reach. Since it was so important for half of the year and the Emini is almost there again, it will probably get there again within a few weeks. Traders will sell rallies until then. Because it was such a strong magnet, it will probably stop the selling for at least a few days. The bulls will need a micro double bottom there if this selloff is just a higher low in a bull trend.
Overnight Emini Globex trading
The Emini is up 34 points in the Globex session. While that is a huge number, it is modest compared to the range of the past two days. After 2 climactic bear days, the Emini will probably trade sideways to up for several days especially after yesterday’s late strong reversal up.
The daily ranges will begin to shrink, but the swings up and down will still be much bigger than normal. Along with smaller ranges, the Emini will become more two sided. The exhausted bears will probably begin to take profits, and value oriented bulls as well as traders will begin to buy. The result will probably be a retracement of this week’s selloff.
Today is Friday so weekly support and resistance can be important, especially late in the day. Targets include the August 2 low of 2800, which is also a Big Round Number. While the bears want the week to close on its low, that is unlikely because 2 climactic days will make bulls and bears buy (bears buy back surprisingly profitable shorts). The result will probably be a sideways to up day. Because the selling has been extreme, there is an increased chance of a bull trend day today.
Yesterday’s setups
Here are several reasonable stop entry setups from yesterday. I show each buy entry with a green rectangle and each sell entry with a red rectangle. I rarely also show limit order entries and entries on the close of bars. My goal with these charts is to present an Always In perspective. If a trader was trying to be Always In or nearly Always In a position all day, and he was not currently in the market, these entries would be logical times for him to enter.
EURUSD Forex minor bull leg in early bull trend
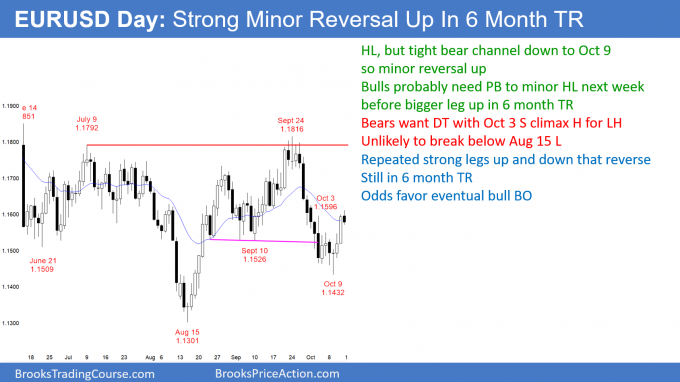
While the EURUSD daily Forex chart rallied strongly this week, the rally followed a tight bear channel. Therefore, the bulls will probably need a test down next week. The day so far is a small bear trend day at the resistance of the October 3 high, the 20 day EMA, and a 50% retracement. The buying is drying up at this resistance.
The EURUSD daily Forex chart retraced half of he October 9 selloff. While the bears want this rally to be a bear flag, it is more likely the first of at least 2 legs up in the 6 month trading range.
A trading range is a neutral environment, which means that the direction of the eventual breakout is as likely to be up as it is to be down. There are factors that change the odds. Here, the monthly chart is in a bull trend. Additionally, the bulls got a dramatically strong reversal up from a breakout below the range. Both of these features make it more likely that the eventual breakout will be up.
However, trading ranges have many strong legs up and down that look like they will successfully break out. But, 80% of trading range breakouts fail. Therefore, a trader will make more money betting on reversals than on trends until after there is a clear breakout.
The daily chart is in the middle of the range. When that is the case, the legs often are brief. At the moment, the bulls will probably need some kind of double bottom with this week’s low before they will be able to test the top of the range at 1.18.
Traders understand the implication of the August bull trend reversal. They therefore will buy strong selloffs to just below the middle of the trading range instead of waiting to buy at the bottom. This will probably result in buyers around this week’s low.
Overnight EURUSD Forex trading
The EURUSD 5 minute Forex chart drifted down 40 pips in a weak bear channel overnight. Most of the bars were small, had prominent tails, and overlapped several prior bars. This is trading range trading. Day traders have been scalping for 10 pips. There is no sign that this is about to change today.
Summary of today’s S&P Emini futures price action and what to expect tomorrow
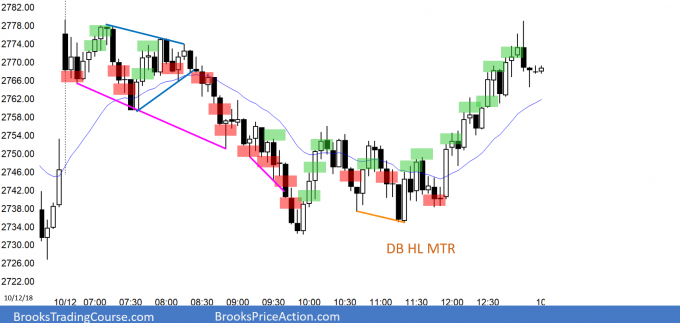
Here are several reasonable stop entry setups for today. I show each buy entry with a green rectangle and each sell entry with a red rectangle. I rarely also show limit order entries and entries on the close of bars. My goal with these charts is to present an Always In perspective. If a trader was trying to be Always In or nearly Always In a position all day, and he was not currently in the market, these entries would be logical times for him to enter.
The Emini sold off in a broad bear channel today, but held above yesterday’s low. It reversed up to close near the high. Today will then be a buy signal bar for Monday. Because it is a doji bar after 2 big bear bars, it is a weak setup. It will probably led to a 1 – 3 day minor reversal up. The odds favor a test below last year’s 2689.75 close within a couple of weeks.
See the weekly update for a discussion of the price action on the weekly candlestick chart and for what to expect going into next week.
Trading Room
Traders can see the end of the day bar-by-bar price action report by signing up for free at BrooksPriceAction.com. I talk about the detailed S&P Emini futures price action real-time throughout the day in the BrooksPriceAction.com trading room. We offer a 2 day free trial.
Charts use Pacific Standard Time
When I mention time, it is USA Pacific Standard Time (the Emini day session opens at 6:30 am PST, and closes at 1:15 pm PST). You can read background information on the intraday market reports on the Intraday Market Update page.


Hi Al: I bought above the 1020am bar, bar 47, thinking it was an Inverse Head and Shoulders / MTR HL buy. What was my mistake there? I see a much better entry signal bar formed 4 bars later, but what was my mistake? Was there just not enough bars in the pattern?
Thanks!
Dave in Florida
I believe I talked about this at the time. There were 3 consecutive bear bars and 6 bars in a tight bear channel. That increased the odds of one more test sideways to down. I don’t know if you were in the trading room, but I said at that time that I just bought SPY calls. This is because I, too, thought that it was a good setup and that we would get back to the high either today or early next week. When we got back to the day’s high, I said that I took profits on my calls.
Your entry was acceptable, but because of the bear bars, the Emini was likely to go sideways and form a double bottom higher low. Consequently, a trader either needed a stop below the low of the day, or he had to exit and then buy again above a bull bar after the double bottom. Because the bars were big, the stop was far. That can make it difficult to manage the trade correctly. It is natural to worry about a big loss. However, you took a reasonable entry.
Wow, that reporter was harsh! But, I agree with Kolanovic because it makes such good sense. All of the institutions and hedge funds buy puts for protection. That means there is huge put selling by option firms who are basically insuring every institution.
When the market goes down, the option gamma has to go up, and these put sellers have to hedge if they don’t want to go under. Their only choice is to sell stock and futures. They are essentially the insurance companies for all of the firms on Wall St. That means their risk is huge.
Their hedging (to protect themselves as they protect everyone else) therefore requires tremendous selling of stocks and futures. Is it exactly 50% of the selling? Who knows, but I do know it has to be about that much because they are insuring all of those institutions who are losing money as the market falls. It sounds reasonable that about the same amount of selling has to come from the insurers (option selling firms), and that means about half of the total selling.
Here’s an interesting note about the JPM head quant saying the same thing as you about option firms adding to the selloff.
https://www.zerohedge.com/news/2018-10-12/kolanovic-biggest-selling-pressure-was-option-gamma-hedging-wednesday