Emini is hesitating after Fed Chair Powell announced rate hikes
Updated 6:40 a.m.
The Emini gapped down and began with a weak bull bar. The bears was a continuation of yesterday’s selloff. However, since today will probably not be a strong bear day, an early 1 – 2 hour selloff will then probably reverse up. The Emini is deciding if the rally will begin on the open or after a 1 – 2 hour selloff.
While the Emini is Always In Short, the bulls will look for a buy setup in the 1st 2 hours for an early low of the day. If instead the selloff is strong, traders will continue to sell rallies to around the moving average until there is a credible bottom or strong reversal up. The selloff can last all day, but this is unlikely. The odds favor a trading range day or a reversal up into a bull trend at some point today.
Pre-Open market analysis
The Emini went sideways yesterday for the 1st half of the day, and then collapsed. It fell below last week’s low after breaking above its high. This week is therefore an outside down week. It also fell below the December 2017 close.
Today is the last day of the week. The bears want the week to close below last week’s low and the 2017 close. This week would be a sign of strong bears. However, the reversals up and down over the past month, and the bull trend on the weekly and monthly charts, make a trading range more likely than a bear trend on the daily chart.
The bulls want the week to close back above last week’s low. They then will try to create a bull inside bar next week. That would be an ioi buy signal on the weekly chart.
After 3 strong bear days, the odds are that today will have more two-sided trading. This is especially true since the weekly and monthly charts are still in bull trends.
Overnight Emini Globex trading
The Emini is down 16 points in the Globex market. Yesterday’s late 2 hour weak rally will probably be a Final Bear Flag. Consequently, if today sells off early, the Emini will probably form an early low of the day.
There is only a 25% chance of a 4th consecutive strong bear trend. This is because the daily chart is more likely in a trading range than a bear trend. The bears will therefore begin to take profits, knowing that the odds of much lower prices without a bounce first are not high.
In addition, as strong as the selling has been this week, it is still only a 50% pullback from a 3 week rally. Therefore, the bears need more relentless selling before traders will believe that this is a bear trend and not just a bear leg in a 2 month trading range.
Reversal day today?
Since today is unlikely to be a bear trend day, it will probably be mostly a trading range day. If it is a bull trend day, the rally will probably not retrace all of yesterday’s selling.
Because yesterday was huge, there is an increased chance that today will be an inside day. Therefore, the bulls will look for an early selloff that reverses up from just above yesterday’s low. However, since today will probably not be a strong bear trend day, the bulls will also buy a reversal up from below yesterday’s low.
After 3 days of strong selling, the bears are probably exhausted. They will therefore be less willing to sell at the lows. Instead, they will look to sell rallies at resistance. Both the 20 bar 60 minute moving average and the 20 day moving average are around 2715. The 2700 Big Round Number is also resistance, as is last week’s low, which is just below that.
Resistance has a magnetic pull. Therefore the Emini will probably rally to at least 2700 today, and that is where the bears will look to sell. The Emini might stall there and end the week in that area.
Yesterday’s setups
Here are several reasonable stop entry setups from yesterday. I sometimes also show limit order entries and entries on the close of bars.
EURUSD failed breakout below double top
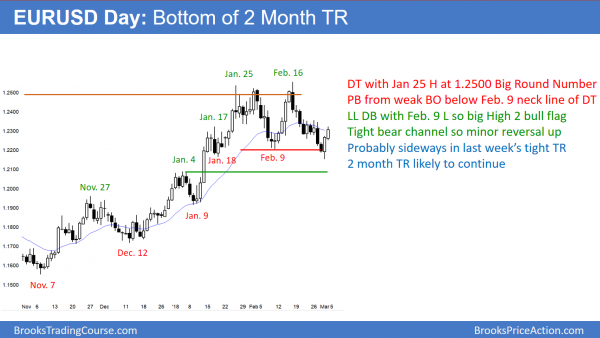
The EURUSD daily Forex chart reversed up yesterday from a failed breakout below a 2 month trading range. Since the 2 week bear channel was tight, the 2 day rally will probably stall here in last weeks 5 day tight trading range.
The EURUSD daily Forex chart has been sideways for 2 months after a year-long rally. I wrote that the bear breakout would probably fail and that the bulls would get about a 150 pip bounce starting within a few days. The 2 day rally has achieved that goal. I also said that the rally would probably go above the top of last week’s small bear flag. That is only 40 pips higher and that is still likely.
Since the daily chart is back in last week’s tight trading range, it will probably go sideways here again for a few days. This is because the market told us that it saw that price as fair, and it probably is still fair. Furthermore, the 2 week selloff was in a tight bear channel. That is unlikely to immediately reverse into a bull leg without first going sideways for a few bars (days). The bears will see that sideways trading as a lower high and bear flag. They hope the the 2 week selloff is the start of a major reversal into a bear trend.
The bulls will see that sideways trading as a pause in the reversal up from the failed bear breakout below the February 9 bottom of the range. They see yesterday’s low as a big High 2 bull flag with that low.
Trading ranges resist breaking out. Consequently, both the bulls and bears will continue their disappointment about the failure of legs to become trends. The 5 week selloff is still more likely a bull flag on the weekly chart. Therefore, the odds still favor a bull breakout within a month or two. In addition, there is a bear trend line on the monthly chart just above the January high. It is a magnet. The market is probably too close to escape the magnetic pull without first touching that line.
Overnight EURUSD Forex trading
The EURUSD 5 minute Forex chart reversed up strongly yesterday. There is still room to the 1.2360 top of last week’s bear flag. In addition, the rally was in a fairly tight bull channel. Therefore, the odds are that bears are trapped in and bulls are trapped out. Hence, both want a pullback to buy. Consequently, the rally will probably have at least a small 2nd leg up after the 1st pullback.
Today is Friday. The weekly chart is forming a High 2 bull flag. This week is the buy signal bar for next week. The bulls want this week to close on its high so that it will be a stronger buy signal bar for next week. The bears always want the opposite.
However, the 2 day rally was strong enough so that this week will probably close at least above its middle. Will it close with a big bull body and become a strong buy signal bar? Probably not because the weekly chart is only slightly more bullish than bearish. There was a 2nd entry sell signal with a good sell signal bar last week. That creates confusion, which will probably continue for at least a couple more weeks. Confusion tends to prevent clear signals. Therefore, today will probably not be another strong bull trend day.
Strong rallies usually transition into trading ranges before reversing into bear trends. As a result, the odds are against a bear trend today. That leaves a trading range day as the most likely outcome. Over the next few days, however, the bulls will look to buy a 50% pullback from this 2 day rally. That will probably be back down around the February 9 low.
Summary of today’s S&P Emini futures price action and what to expect tomorrow
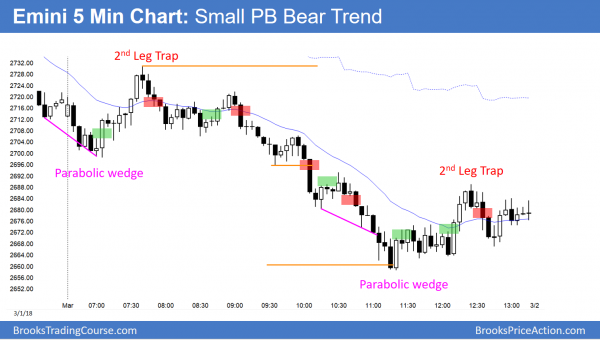
The Emini reversed up from a breakout below yesterday’s low. After a 3 hour trading range, the rally resumed up to the low of last week.
Before the open, I said that the Emini would probably rally from an early low of the day. The target was the low of last week. This week was an outside down bar on the weekly chart and the bulls succeeded in erasing some of the bearishness by getting back to last week’s low at the end of the day.
Next week will probably have a rally for a few days. It will likely form a lower high and lead to a 2nd leg sideways to down from the wedge lower high on the daily chart.
See the weekly update for a discussion of the price action on the weekly candlestick chart and for what to expect going into next week.
Traders can see the end of the day bar-by-bar price action report by signing up for free at BrooksPriceAction.com. I talk about the detailed S&P Emini futures price action real-time throughout the day in the BrooksPriceAction.com trading room. We offer a 2 day free trial.
When I mention time, it is USA Pacific Standard Time (the Emini day session opens at 6:30 am PST, and closes at 1:15 pm PST). You can read background information on the intraday market reports on the Intraday Market Update page.


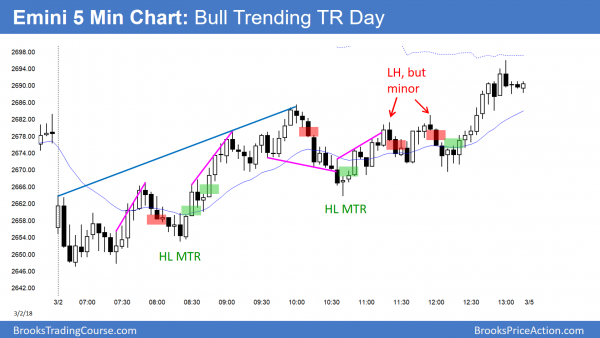
On the 2nd HL MTR around 10:45 on the S and P, do you consider this a strong buy? It seems all the big bear bars to the left make it lower probability. I would like to understand what factors make it a buy at this point. Thanks!
I agree that the 9 bar bear micro channel lowered the probability. Yet, I talked repeatedly today in the room that the low of last week was a magnet, and the Emini might get there by the end of the day.
I thought of that selloff as an End Of The Day Bear Trap. It is common in a day that is likely to rally into the close to have a strong selloff around 11 am. It traps bulls out and bears in.
Your point about the minor reversal being likely is correct. When the leg down to the HL MTR is tight and has a lot of bear bars, the reversal is usually minor. The bulls usually need some kind of double bottom to then get a major reversal. The minor reversal led to a trading range, which was likely. There was a DB within the trading range, and that led to an end of the day and week Buy The Close vacuum test of last week’s low.
Hi Al,
The range has been wide, about 4-6 points in the 5mins per candle for the past 3 days, in the emini.
In one of your past video, you did talk about, getting in the trend in the 1min or 3mins chart, if we cannot risk that much.
Do you think, its a good idea, gaining an entry in the 1min or 3mins chart
I often do that when the range is big. I think if a trader can make money and is happy, doing anything is good.
There are several things that make trading the 1 min difficult. The 1st is that a trader has much less time to make decisions, and therefore he will make more mistakes.
Also, the bar can dramatically change its appearance in the final second. If a trader is not expecting the change, he can miss a good trade.
Then, there is the issue of slippage. I took several trades on the 1 min chart today and had 3 ticks slippage on one entry.
Beginners usually find themselves always looking for reversals. They don’t notice that a channel is tight or that the 5 min chart is in a strong trend. They want smaller risk and clear stops, and therefore reversals are appealing. They ignore probability, and the result is that they continue to lose small amounts all day. That adds up.
There are other difficulties as well, but if a trader can do it profitably, then it is a good option.