Emini island top reversal pattern
Updated 6:59 a.m.
The Emini opened with a Sell The Close selloff. The bears want to get below last week’s 2167.75 low, which would make this week an outside down week. The bulls always want the opposite and will buy above last week’s low. They therefore are trying to create an Opening Reversal and early low of the day.
At the moment, the Emini is Always In Short and there is a 50% chance that we have seen the high of the day. Yet, many days over the past 2 months have had early selloffs that reversed up above the open. Yesterday was an example. The selloff is strong enough so that a strong bull trend day is unlikely. The bears have a 30% chance of a strong bear trend day. At the moment, sideways to down is most likely over the next 2 hours.
Because most days have had early trading ranges, the Emini will probably go sideways soon. If the bulls are unable to create a strong reversal up, the bears will sell the pullback. This initial selloff might be a Spike in a Spike and Channel Bear Trend. Yet, since strong bear trends come only a few times a month, the odds favor a weaker bear trend, like a Trending Trading Range Day or a Broad Bear Channel.
Pre-Open Market Analysis
Yesterday gapped down, and therefore Monday was an island top. Although island tops and bottoms sometimes lead to reversals, most do not. The bears need follow-through selling over the next few days. Without it, yesterday will just be another pullback in a bull trend.
Because of the nested Final Flags on the daily, weekly, and monthly charts, and the buy climaxes on the weekly and monthly charts, the odds favor a 2 – 5% correction within the next few weeks. While Monday’s island top might be the start, the bears need a strong bear breakout. If they do not get one soon, the bulls will resume buying. Hence, they will try to reach the targets above that are between 2200 and 2220.
Emini Globex session
While the Emini continued down in its 3 day, relatively flat Broad Bear Channel overnight, it is still above the August 10 higher low on the 60 minute chart. It is therefore still in a bull trend. The bears need a strong breakout to convince traders that the Emini will trade down for the next several weeks. As a result of continued higher lows, the odds still favor at least one more new high. Furthermore, the resistance around 2200 continues to pull the Emini up.
Yet, if the Emini gets there, the odds favor profit taking for at least a couple of weeks. This would probably create a 50 – 100 point pullback.
Forex: Best trading strategies
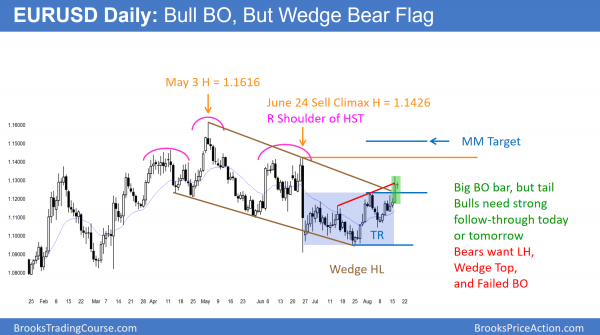
While yesterday broke above the trading range, the bar had a big tail on the daily chart. Hence, there was a lack of resolve on the part of the bulls. So far, today is a doji inside day, which again shows hesitation.
Yesterday was a big bull trend bar on the daily chart. It closed far above the top of the month-long trading range. Yet, it had a big tail on top and it still was a lower high in a broad bear channel. Furthermore, it was also forming a 3rd leg up in a Wedge Bear Flag. The bulls need a bull trend bar today or tomorrow to confirm the breakout. If instead the bears get a bear bar, even a small one, the odds of yesterday being a successful breakout fall to less than 50%.
Yet, if today or tomorrow is a big bull trend bar, yesterday would probably be a Measuring Gap. In addition, traders would probably buy the 1st reversal down. As a result, traders would expect at least a 2nd leg up.
Overnight EURUSD Forex trading
Yesterday was a buy climax on the 60 minute chart. The EURUSD Forex market has been in a tight trading range since then. While the odds still favor at least a small bull breakout, traders are aware that this range might be the Final Bull Flag and lead to a reversal down. If instead the bulls get a strong bull breakout, yesterday’s buy climax might become a measuring gap. The gap is the space between yesterday’s close on the daily chart and the top of the month-long trading range.
Day traders have been scalping overnight. Without a clear breakout, they will continue to scalp today. Yet, this one day trading range will probably end today or tomorrow and lead to either another leg up or a strong reversal down.
Summary of today’s S&P Emini futures price action and what to expect tomorrow
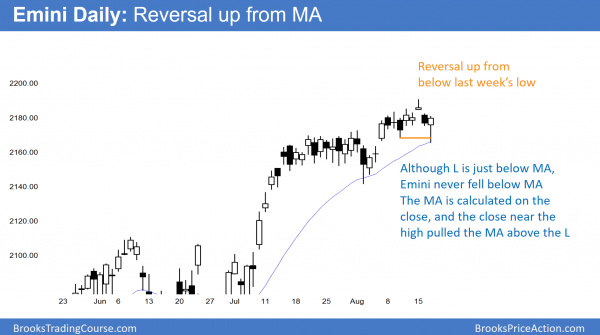
The daily chart of the Emini reversed up from below last week’s low and from a test of the daily moving average (20 day EMA).
While today was a bull reversal day, the bulls were unable to break strongly above the 60 minute moving average. The bulls want to erase Monday’s island top. Their best case would be a gap up tomorrow, which would make today an island bottom. It would be a sign of strength and therefore increase the chances of a test of the 2200 area. The bears want today’s rally to form a lower high major trend reversal on the 60 minute chart. At the moment, because of the 8 day trading range, the probability is the same for both.
See the weekly update for a discussion of the price action on the weekly candlestick chart and for what to expect going into next week.
Traders can see the end of the day bar-by-bar price action report by signing up for free at BrooksPriceAction.com. I talk about the detailed S&P Emini futures price action real-time throughout the day in the BrooksPriceAction.com trading room. We offer a 2 day free trial.
When I mention time, it is USA Pacific Standard Time (the Emini day session opens at 6:30 am PST, and closes at 1:15 pm PST). You can read background information on the intraday market reports on the Intraday Market Update page.


Hi Al,
Do you pay attention to outside bars on 5mins chart? I only take these into account when they form close to resistance or support. I buy above and sell below with pending reversal orders in place. Is this reasonable approach to trade outside bars or do we need to consider any other factors as well?
Many Thanks
Saad
It depends on context, as I’ve written in my books and said in the videos. If they are in a tight trading range, traders fade breakouts. If they are at a logical reversal area, they can be entry bars or signal bars.