Emini January parabolic wedge buy climax should end this week
I will update again at the end of the day.
Pre-Open market analysis
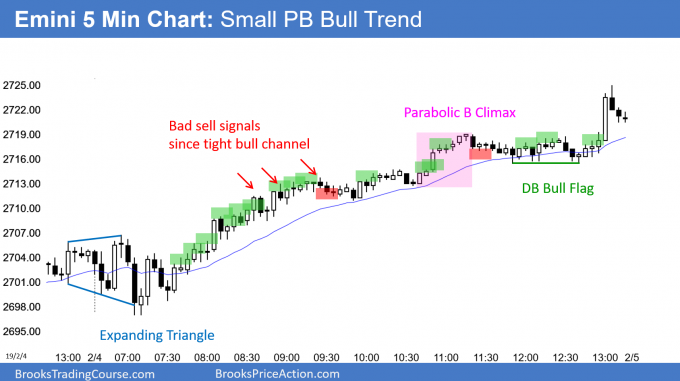
After an early trading range, yesterday entered a Small Pullback Bull Trend. Furthermore, Friday was a pause after a 2 day breakout. The odds favor at least a 1 – 2 day rally from there.
But, the daily chart is in a buy climax. In addition, the Emini is above the December 12 crash high. This is therefore the sell zone. Consequently, the Emini’s month-long rally will probably end this week.
Since the rally was strong, the bulls will probably buy a 2 – 3 week, 50% selloff. There is support around the February 2018 low and 2,500. The odds favor the pullback starting either this week or next. The first target is the 2,600 – 2,650 trading range from 2 weeks ago.
Less likely, this rally will continue up to the October – December triple top without much of a pullback.
Overnight Emini Globex trading
The Emini is up 6 points in the Globex session. If there is a small gap up, it will probably close in the 1st hour. The huge bull bar at the end of the day was climactic. That increases the odds of a trading range forming early today.
After any relentless trend, like yesterday, there is a 75% chance of a 2 hour trading range that starts by the end of the 2nd hour. But, there is a 50% chance of follow-through buying in the 1st 2 hours. Even if the bulls buy early, there is only a 25% chance of a 2nd big bull day.
Last week was the 6th consecutive bull bar on the weekly chart. That is unusual. Therefore, it would be even more unusual for this week to be a 7th bull bar. Consequently, despite yesterday’s rally, there is at least a 50% chance that Friday will close below yesterday’s open. That would create a bear body on the weekly chart.
Yesterday’s setups

Here are several reasonable stop entry setups from yesterday. I show each buy entry with a green rectangle and each sell entry with a red rectangle. I rarely also show limit order entries and entries on the close of bars. My goal with these charts is to present an Always In perspective. If a trader was trying to be Always In or nearly Always In a position all day, and he was not currently in the market, these entries would be logical times for him to enter.
EURUSD Forex market trading strategies

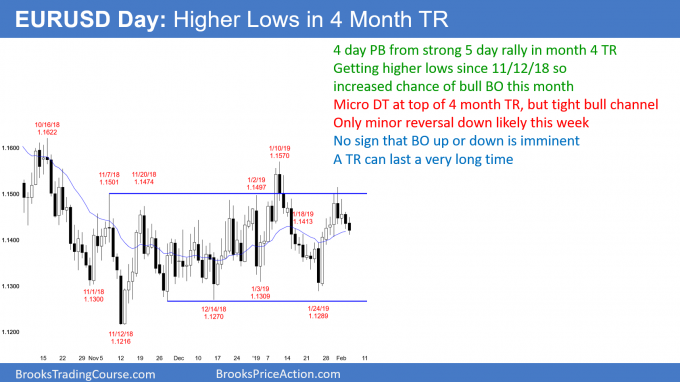
The EURUSD daily Forex chart is in its 4th day of a pullback from a test of the top of the trading range. It is now testing its 20 day EMA and almost the 50% retracement level. Since January 25 broke above a big bear bar, the high of that January 24 bear bar is a breakout point.
A breakout point is a magnet. This one is only 30 pips lower. Therefore, the pullback might fall below 1.14 before the bulls will buy again.
Has the selloff fallen far enough to make traders belief that it is now going to test the bottom of the 4 month range? No, it is still more likely a pullback from the top. Consequently, the bulls are still looking for a reversal up from around the current level.
Overnight EURUSD Forex trading
The selloff has been in a bear channel on the 60 minute chart for 3 days. A bear channel is a bull flag. This is a Spike and Channel Bear Trend, with January 31 being the bear spike. A bear channel is a bull flag. Therefore, the odds are that there will be a break above the 3 day bear channel this week.
The first target is the top of the channel. That is the February 1 high of 1.1489. Then, the chart will probably go sideways for a few days. At that point, the bears will have a double top and the bulls will have a bull flag. The 60 minute chart would be in breakout mode.
The 5 minute chart has been in a 30 pip range overnight. There is no sign of a reversal yet. Furthermore, that January 25 high is a magnet below. Many bulls are waiting to see if the pullback will reach that support before they will buy. Alternatively, they will buy if there is a surprisingly strong bull breakout today or tomorrow. The odds favor a test of 1.1490 within a week.
Since the past several days have been small. Daytraders have been scalping. However, the selloff is near support. That increases the chance of a swing up this week. Less likely, the bears will get a strong break below support and then a test of the bottom of the 4 month range.
Summary of today’s S&P Emini futures price action and what to expect tomorrow

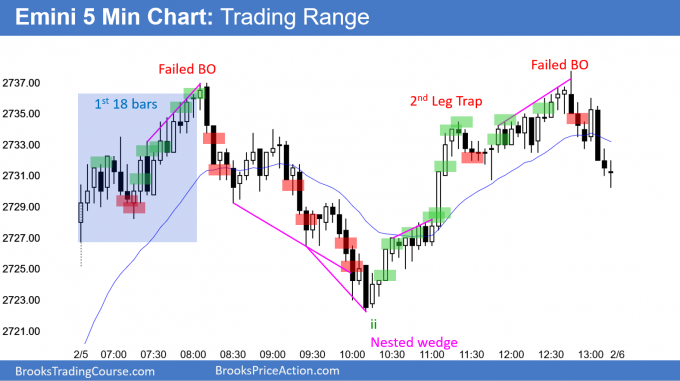
Here are several reasonable stop entry setups for today. I show each buy entry with a green rectangle and each sell entry with a red rectangle. I rarely also show limit order entries and entries on the close of bars. My goal with these charts is to present an Always In perspective. If a trader was trying to be Always In or nearly Always In a position all day, and he was not currently in the market, these entries would be logical times for him to enter.
End of day summary
The Emini broke above, below, and back above the range of the 1st 18 bars. That is unusual. The day was a trading range day, and weak follow-through after yesterday’s buy climax.
The daily chart is still in a parabolic wedge buy climax. In addition, it is in the sell zone, which is above the December 12 stock market crash high. Consequently, the bulls will begin to take profits. This should result in a 2 – 3 week pullback beginning this week.
This week so far is a bull bar on the weekly chart. But it is the 7th consecutive bull bar, which is rare. It is therefore a buy climax. Unless tomorrow is a strong bull bar, the Emini will probably reverse down into the end of the week and close below the open of the week.
See the weekly update for a discussion of the price action on the weekly chart and for what to expect going into next week.
Trading Room
Traders can see the end of the day bar-by-bar price action report by signing up for free at BrooksPriceAction.com. I talk about the detailed S&P Emini futures price action real-time throughout the day in the BrooksPriceAction.com trading room. We offer a 2 day free trial.
Charts use Pacific Standard Time
When I mention time, it is USA Pacific Standard Time (the Emini day session opens at 6:30 am PST, and closes at 1:15 pm PST). You can read background information on the intraday market reports on the Intraday Market Update page.
sorry one more question,
bull bar 1 still had a body gap during bull 9 /DB-H2. Would you consider this, as another clue to buy?
thx
HI Al, in your course on Channels 16A you mention about rule of 70 % reversal from channel line overshoot, with important note depends on the TF where channel line is present.
Looking at 15 min chart this was met more or less within 7 bars if I draw channel line from 04/02/19, but there is actually another channel line on 15 min, which I can draw from 25/01/19 and market reversed within 3 bars.
How do you prioritise channel lines?
thx
This question came up in the trading room today. I mentioned that I always look for the highest time frame that has the channel or a channel. In addition, I want to see about 10 or more bars in the legs. The 30 and 60 minute charts were good. I think they were more important than the 5 minute. Also, there were multiple ways to draw the lines on the 5 minute. That lack of consensus dilutes the significance of the lines.