Emini and Forex Trading Update:
Monday May 20, 2019
I will update again at the end of the day.
Pre-Open market analysis
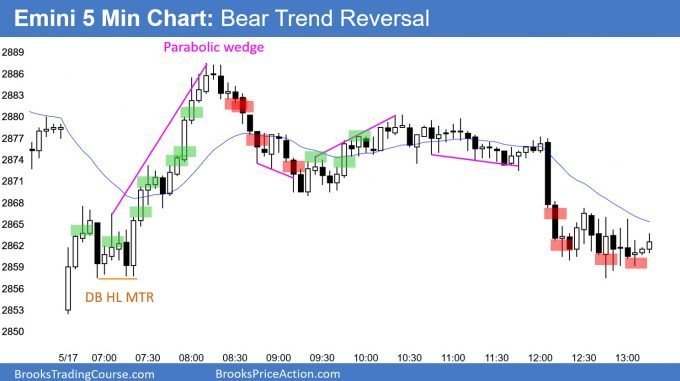
The Emini had an early rally again Friday, and then sold off, like it did on Thursday. However, 7 of the past 8 days had bull bodies on the daily chart. That is a sign of buying pressure and it reduces the chance of a bear trend beginning today.
But nothing has changed. Whether the 4 day rally continues for a few days or not, the odds still favor a 2nd leg down. There is a small double top with Thursday’s high and the May 10 high. The 2nd leg up in a double top often has many bull bars.
If the bulls get a reversal down this week, the next target is the March 13 low of 2802.00. That is the neck line of the double top. A measured move down from there would test 2700 and close the gap above the February 8 high of 2726.50.
Overnight Emini Globex trading
The Emini is down 23 points in the Globex session. It will probably gap below Friday’s low. That would trigger a sell signal on the daily chart for the May 10/May 16 double top.
But, because Friday had a bull body, it is a lower probability sell signal bar. That increases the chance that today’s selloff would be just another leg in the 2 week trading range. Consequently, the bulls will look for a reversal up either on the open or in the middle of the day.
However, if there is a selloff and the pullbacks are small, today could be a Small Pullback Bear Trend day. That would encourage day traders to hold onto at least part of their short trades for a swing down that could last most of the day.
Friday’s setups

Here are several reasonable stop entry setups from Friday. I show each buy entry with a green rectangle and each sell entry with a red rectangle. I rarely also show limit order entries and entries on the close of bars. Buyers of the Brooks Trading Course have access to a much more detailed explanation of the swing trades for each day.
My goal with these charts is to present an Always In perspective. If a trader was trying to be Always In or nearly Always In a position all day, and he was not currently in the market, these entries would be logical times for him to enter.
EURUSD Forex market trading strategies

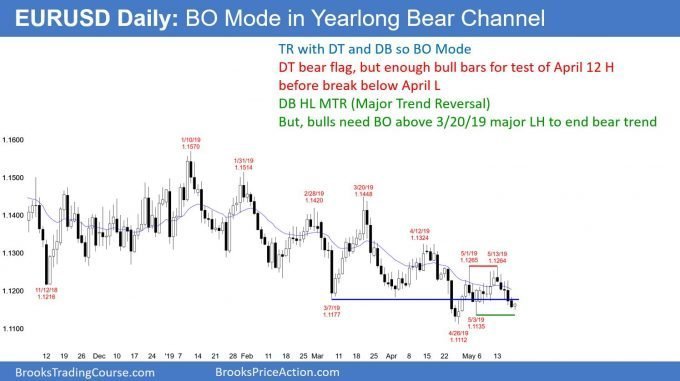
The EURUSD daily Forex chart has been in a bear channel for a year. It was also in a tight trading range for 5 months, but broke below in April. It again has been going sideways for a month. The bears have a double top. They want a break below the May 3 neck line and then a 150 pip measured move down.
Every trading range always has a buy setup in addition to a sell setup. The bulls want a reversal up today. That would form a double bottom buy signal with the May 3 low.
Furthermore, the double bottom would be a higher low major trend reversal. Finally, the rally to the May 1 lower high had fewer bars than most other bear rallies over the past year. That makes it likely that the bear rally might not have ended. The bulls therefore are hoping for a 2nd leg up to above the May 12 high.
However, unless the bulls break strongly above the March 20 major lower high, the bear channel and bear trend are still intact. That means the odds will continue to favor new lows and lower highs.
Overnight EURUSD Forex trading
The EURUSD 5 minute Forex chart has been mostly sideways in the US sessions over the past month. Since the daily chart is testing the May 3 low, this is a buy zone.
The daily chart rallied from 1.11 and 1.1135 over the past month and the bulls hope to begin a leg up from here again. In addition, there is a micro wedge on the daily chart over the past 3 days. The wedge bottom is easier to see on a 60 minute or 4 hour chart. That increases the chance of a bounce early this week.
Will the bulls get a strong bull trend reversal on the daily chart? There is now a double bottom higher low bull trend reversal buy setup on the daily chart. They might get a 2 week rally to above the April 12 minor lower high. As a result, day traders will be more willing to swing part of their longs if the rallies on the 5 minute chart are strong.
However, the 5 minute chart has been in a 20 pip range over night. Day traders are having a difficult time making even 10 pip scalps. But, the odds favor a bounce within the next couple days.
Can the bears get a surprisingly big selloff to below the April low? While possible today, it is not likely. The daily chart has been quiet for a month. Day traders know that the odds are that each day will probably be fairly small and that reversals are more likely than successful breakouts.
Summary of today’s S&P Emini futures price action and what to expect tomorrow

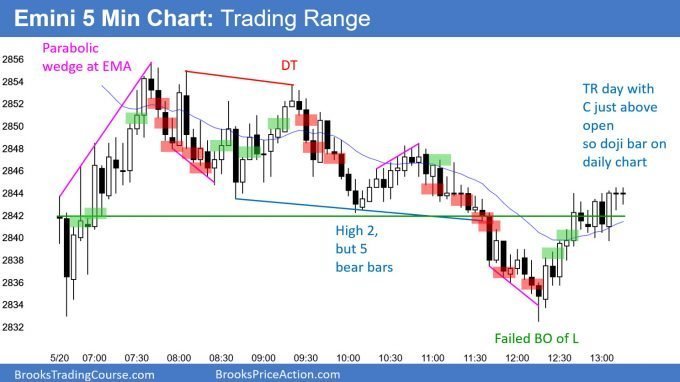
Here are several reasonable stop entry setups for today. I show each buy entry with a green rectangle and each sell entry with a red rectangle. I rarely also show limit order entries and entries on the close of bars. Buyers of the Brooks Trading Course have access to a much more detailed explanation of the swing trades for each day.
My goal with these charts is to present an Always In perspective. If a trader was trying to be Always In or nearly Always In a position all day, and he was not currently in the market, these entries would be logical times for him to enter.
End of day summary
The Emini reversed up from a big gap down, but then entered a trading range. In the final hour, it sold off to a new low of the day. However, it reversed back up and closed in the middle. Today was trading range today.
The Emini is in the middle of a 3 week trading range. Traders are deciding it the correction has ended or if it will continue down to close the February 11 gap. The odds slightly favor a 2nd leg down to that gap before a new all-time high.
It is important to note that today was the 5th consecutive bull day on the daily chart. In addition, there have been 10 bull days in the past 12 days. This is buying pressure and it might be a sign that the correction has ended. There is an increased chance of one or more big bull trend days this week.
See the weekly update for a discussion of the price action on the weekly chart and for what to expect going into next week.
Trading Room
Traders can see the end of the day bar-by-bar price action report by signing up for free at BrooksPriceAction.com. I talk about the detailed S&P Emini futures price action real-time throughout the day in the BrooksPriceAction.com trading room. We offer a 2 day free trial.
Charts use Pacific Standard Time
When I mention time, it is USA Pacific Standard Time (the Emini day session opens at 6:30 am PST, and closes at 1:15 pm PST). You can read background information on the intraday market reports on the Intraday Market Update page.
Hello! I never thought I would do this, as in question your decisions, but here goes:
I see you have a buy order on bar 3. This after a big doji a very big bear and ok, the bullbar has very little tail. Is this why you make it a buy? Because I trade Globex, and the indexes (all I look at, Dax/Dow and Emini (futures SP) were in a 6hour bear trend. (From Europe opening).
I just think this is unusually aggressive for you. Do you have any additional comments on why you think 3 is a buy bar other than “BTC” bar?
That is a standard pattern. There was a gap down and then a one bar sell climax. The next bar had a big bull body and it closed near its high. That is a common opening reversal buy setup. If you have access to The Quick Reference PowerPoints, you will see many examples.
AH! I actually used those several times. Sometimes, when trading Europe daytime, it is easy to forget that in addition to the bars “explode”, it is a reset at open :). What I do find interesting is that price often react to both Globex Moving average (as in that counting all night), and also with the one “restart” at open from yesterdays bars.
Al,
Why isn’t bar 8 a buy like friday’s bar 15?
Why is friday’s bar 17 a buy, and today bar 13 is not? Both parabolic wedges and climax late in bull
Thanks.
One more thing:
Would bar 77 and 79 be valid entries if not around the close, why?
Thanks again
I’ll take a stab at this…all of friday’s buys that you mention are coming off of a breakout from a DB HL MTR. Today’s rally from the open was weak with prominent tails so there is an increased chance that there could be bears selling where you are putting in stop entry buys. Look at the buy over buy 11…a strong bull bar coming out of a triangle-ish trading range. Just my .02.
Yes, I agree. Friday had consecutive big bull bars closing near their highs. Also, there were 4 consecutive bull bars on the open and again staring at bar 10. Good buying pressure.