Emini and Forex Trading Update:
Monday July 1, 2019
I will update again at the end of the day.
Pre-Open market analysis
June is a buy signal bar on the Emini monthly chart. There is an oo bull flag (consecutive outside bars). If July goes above the June high, which it probably will given the likely big gap up today, it will trigger the buy signal and probably trade higher for a few months.
The bears instead want to keep July from going above the June high. If the monthly buy signal triggers, they will sell, hoping to make the breakout fail. If they can get July to close near its low, it would then be a sell signal bar for an expanding triangle top on the monthly chart. The top of the triangle is around 3040, which is therefore a magnet above.
Overnight Emini Globex trading
The Emini is up 34 points in the Globex session. Today will therefore probably gap up to a new all-time high. That will trigger the monthly buy signal.
A big gap up increases the chance of a trend day. A bull trend day is slightly more likely. But, there is only a 20% chance of a strong trend up or down from the open.
When the Emini opens far above its 20 bar EMA, many traders do not want to pay far above the average price. Consequently, a big gap up typically forms an early trading range. The bears will sell rallies. They want a double top or wedge top and an early high of the day. The bulls want any early selloff to around the EMA to reverse up from a double bottom or a wedge bottom.
These trading range openings for the 1st 60 – 90 minutes occur 80% of the time when there is a big gap up or down. That 2 sided price action indicates balance and it reduces the chance of a very strong trend day. The trend usually weakens after a few hours. There is then a trading range, which can last for the remainder of the day, or the trend can resume or reverse.
Friday’s setups

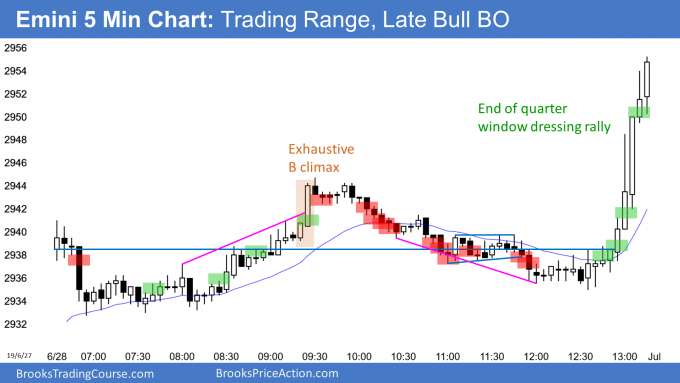
Here are several reasonable stop entry setups from Friday. I show each buy entry with a green rectangle and each sell entry with a red rectangle. I rarely also show limit order entries and entries on the close of bars. Buyers of the Brooks Trading Course have access to a much more detailed explanation of the swing trades for each day.
My goal with these charts is to present an Always In perspective. If a trader was trying to be Always In or nearly Always In a position all day, and he was not currently in the market, these entries would be logical times for him to enter.
EURUSD Forex market trading strategies

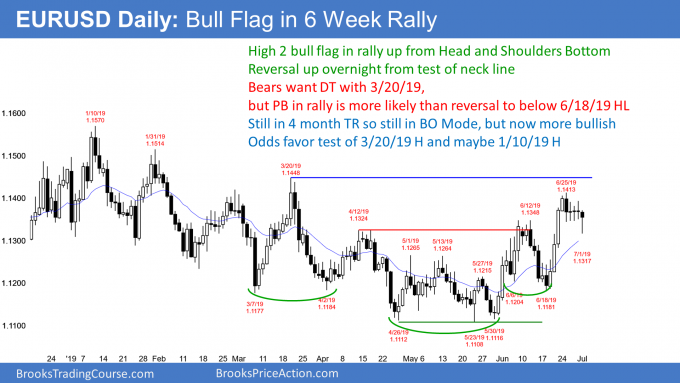
The EURUSD daily Forex chart broke above an ii bull flag on Friday. It then broke below overnight. However, so far, today is the 4th consecutive doji bar. This is not strong selling. More likely, the 5 day pullback is a test of the neck line of the 4 month head and shoulders bottom. The March 20 lower high is major and therefore a magnet above. Since it is nearby, the rally will probably test it within 2 weeks.
Overnight EURUSD Forex trading
The EURUSD 5 minute Forex chart sold off overnight to just above 1.13. I have been saying for over a week that there would be a pullback to around 1.13. With the 40 pip reversal up, this might be the end of it.
However, there has been no bull bar in 5 days. Consequently, the bulls have not yet been buying aggressively. Therefore, this pullback might test below 1.13 and last another week or so.
Day traders will scalp today
The 40 pip rally over the past 5 hours has had only small pullbacks. However, the rally is back to Friday’s low. Friday was a sell signal bar on the daily chart for a 4 day Low 2 top, but this rally weakens the bear case.
The bears will begin to sell around Friday’s low and in the 4 day tight trading range. They want the rally to be simply a pullback to the 4 day tight trading range. They then want another leg down to below 1.13.
Because the rally is back to the 4 day tight trading range, bear day traders will begin to sell for 10 pip scalps. They are confident that the 5 minute chart will again have trading range price action now that it is back in last week’s trading range. However, they know that today will probably not get back to the overnight low.
Since today is a possible buy signal bar on the daily chart, the bulls want today to be a bull bar that closes near its high. They will therefore buy 20 pip pullbacks. However, they, too, will probably scalp since the rally is back in last week’s trading range and is not likely to break above it today.
Summary of today’s S&P Emini futures price action and what to expect tomorrow
I will post chart after the close.

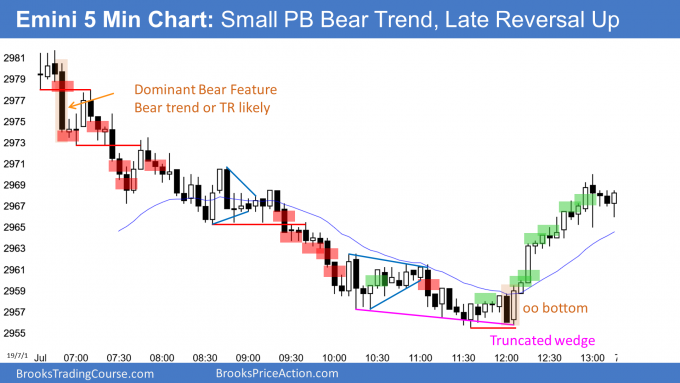
Here are several reasonable stop entry setups for today. I show each buy entry with a green rectangle and each sell entry with a red rectangle. I rarely also show limit order entries and entries on the close of bars. Buyers of the Brooks Trading Course have access to a much more detailed explanation of the swing trades for each day.
My goal with these charts is to present an Always In perspective. If a trader was trying to be Always In or nearly Always In a position all day, and he was not currently in the market, these entries would be logical times for him to enter.
End of day summary
The Emini gapped up on the daily, weekly, and monthly charts today. The selloff closed the gaps on the weekly and monthly charts, but the daily gap stayed open. By going above the June high, the Emini triggered a monthly oo buy signal.
The bears had a Small Pullback Bear Trend for 5 hours. They were unable to close the gap on the daily chart. There was an oo bottom just above Friday’s high, and it led to a rally to around the June high.
Whenever there is a big gap, there is an increased chance of the Emini going sideways for a few days. That is what is likely here. The bears see today as a sell signal bar for a failed breakout to a new high. However, the bulls see it as both a breakout and a pullback. The odds favor a move to above 3,000 this month.
See the weekly update for a discussion of the price action on the weekly chart and for what to expect going into next week.
Trading Room
Traders can see the end of the day bar-by-bar price action report by signing up for free at BrooksPriceAction.com. I talk about the detailed S&P Emini futures price action real-time throughout the day in the BrooksPriceAction.com trading room. We offer a 2 day free trial.
Charts use Pacific Standard Time
When I mention time, it is USA Pacific Standard Time (the Emini day session opens at 6:30 am PST, and closes at 1:15 pm PST). You can read background information on the intraday market reports on the Intraday Market Update page.
Al, If you have time, I’m still confused how to distinguish a bear channel from a trading range. As you said, channels always look like they are bout to reverse, so they look like trading ranges at first. I fully understand the theory, but it seems many of the stop shorts which were appropriate for a bear channel would be selling too low for a trading range. As I stated in my question, I am comfortable with wide stops and scaling in. I held 16 MES contracts down to yesterday’s high. As a solution, is it safer to sell too low in a trading range with the option to scale in higher than it is to buy too high in a bear channel and risk a big adverse move? I’m distressed over how to trade these.
A channel is a trading range that is at an angle rather than sideways. If you are not sure if it’s a bull or bear channel then treat it like a trading range. The real question in channels is whether the channel is tight or broad. A tight channel is a breakout on a higher time frame and should be traded like one: only trade in the direction of the trend. A broad channel can be traded like a trading range: BLSHS especially if you can scale in on counter-trend trades. If you are not comfortable scaling-in then just trade with the trend and BL in bull channels and SH in bear ones.
Thanks, Andrew, for your reply. Your comments about a tight channel being a breakout on a higher time frame in interesting. I have heard and read Al make this statement in the trading room, in the videos, and in his books, and I saw it as useful explanatory information, but until now I didn’t know how to use it to assist with trades. But looking at the 15-minute and 60-minute charts from today, it was clear that the first 5 hours on the 60-minute chart and the first 8 bars on the 15-minute chart were clearly in a tight bear trend. Had I paid more attention to these charts, which I keep on a 2nd monitor on my trading setup, I could have focused more on trend continuation rather than trying to pick trading range reversals.
I’ll give it a try Richard. You commented, “it seems many of the stop shorts which were appropriate for a bear channel would be selling too low for a trading range.” I don’t think your wrong about this observation, but something I look for to give me confidence that the market is indeed in a channel and not in an evolving TR is for the market to ignore well formed DB, DT, wedge bottoms, or wedge tops. When a pull back off a well formed pattern is weak, it makes a small pb trend much more likely, and the trend is likely to continue for at least a measured move down. There were also a lack of clear 2nd leg traps and large climaxes, which entices profit taking and increases the odds of larger PB’s and TR behavior.
Thanks, Paul, for your comments. I do see a failed DB, and there was no follow through from bull flags. I assume you mean by second-leg traps that trading ranges tend to have lots of two-legged moves, which were absent today. I will try to spot these in the future. One thing that makes the identification of a bear channel difficult for me is that with small-pullback bear trends there should be gaps which are not filled. These are easy to spot and make small-pullback bear trends easier to identify. Channels do not form gaps, and therefore seem like they could reverse at any time. This makes it difficult to sell below bear bars which appear to be in the “buy zone” with no nearby location to place a protective stop.