Emini and Forex Trading Update:
Thursday May 28, 2020
I will update again at the end of the day.
Pre-Open market analysis
Yesterday traded below Tuesday’s low and then above its high. It was therefore an outside up day. That increases the chance of higher prices today or tomorrow.
The Emini is in the Sell Zone on the daily chart, which is between the 200 day moving average and the March 3 lower high. It will probably get to the March 3 high before exhausting itself. Once the bulls are exhausted, there will probably be a 50% retracement of the 2 month rally.
Tomorrow is the end of the month. Traders are thinking about what May will look like on the monthly chart. If the bulls can get May to close near its high, traders will expect higher prices in June.
The bears want a conspicuous tail on the top of this month’s candlestick on the monthly chart. To achieve that, they will need May to close at least 50 points below this week’s high. There is therefore an increased chance of a selloff today or tomorrow. If the bears succeed, it will reduce the chance of the bulls having a strong June.
Regardless of what happens, traders should expect a selloff for several weeks now that the daily chart is in the sell zone. It probably will begin closer to the March 3 high.
Overnight Emini Globex trading
The Emini is up 2 points in the Globex session. Yesterday rallied in a very strong bull trend. That typically attracts profit taking. There is a 75% chance of at least a couple hours of sideways to down trading today that starts by the end of the 2nd hour.
For the bears, their 1st target is the bottom of the most recent buy climax from yesterday. That is around 12:10 PST on the 5 minute chart. They probably cannot get a strong trend down without the Emini first transitioning into a trading range for an hour or two.
The bulls always want a big bull trend day. After a buy climax day, there is a 50% chance of some follow-through buying in the 1st 2 hours, but only a 25% chance of another strong bull day.
After a big outside up day, there is an increased chance of an inside day. If today opens below yesterday’s high, it might reverse down from below yesterday’s high. Since yesterday’s range was big and today will open near yesterday’s high, today will probably not fall below yesterday’s low.
Yesterday’s setups

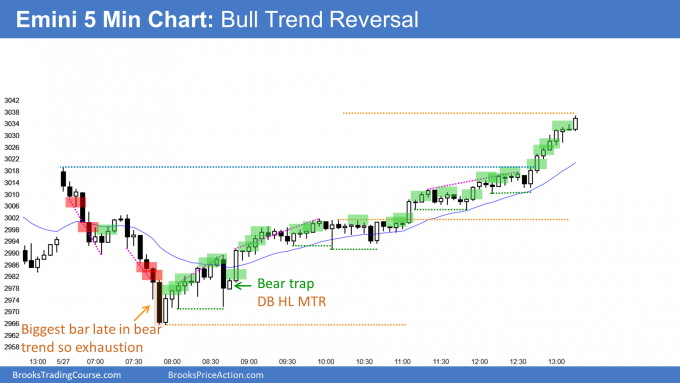
Here are several reasonable stop entry setups from yesterday. I show each buy entry with a green rectangle and each sell entry with a red rectangle. I rarely also show limit order entries and entries on the close of bars. I do not want the lines to be distracting. If they are longer, I make them dotted. But, they have to be visible, so I make the shorter ones solid. Buyers of the Brooks Trading Course and Encyclopedia of Chart Patterns have access to a much more detailed explanation of the swing trades for each day (see Online Course/BTC Daily Setups).
My goal with these charts is to present an Always In perspective. If a trader was trying to be Always In or nearly Always In a position all day, and he was not currently in the market, these entries would be logical times for him to enter.
If the risk is too big for your account, you should wait for trades with less risk or trade an alternative market like the Micro Emini.
EURUSD Forex market trading strategies

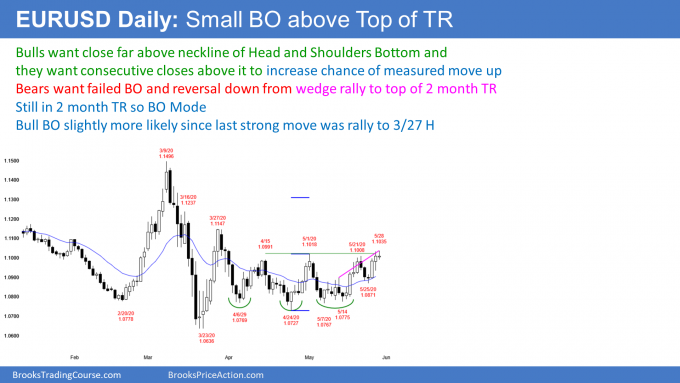
The EURUSD Forex market on the daily chart has rallied to slightly above the 2 month trading range. But the breakout so far is small and it has a wedge shape.
If the bulls do not start to get closes far above the top of the range, traders will expect a test back down. A test of resistance often has 3 legs up, which means it is a wedge. A wedge is a type of sell climax.
When there is a reversal down, traders look for at least a couple legs down. The 1st target for the bears is the bottom of the most recent leg up. That is the May 25 low.
May ends in a few days. So far, it is within the April range on the monthly chart (not shown). April is also within the March range. Consecutive inside bars is an ii pattern (inside-inside). That often leads to a breakout that lasts many bars. Traders might be waiting for June before creating a strong breakout.
Overnight EURUSD Forex trading
The 5 minute chart of the EURUSD Forex market has been in a small range overnight. It traded again above the May 1 high but reversed down.
Today so far has a bull body on the daily chart. However, the bodies are shrinking as the bulls try to get a successful breakout. Shrinking bodies mean there is a loss of momentum. There are fewer bulls eager to buy at this price.
The bulls still hope for a strong breakout. At a minimum, they want another bull body on the daily chart. They will buy selloffs and try to have the day close above the open. They prefer to have it close above yesterday’s high. That would indicate that the momentum is increasing. It would increase the chance that this breakout will be successful.
The bears want today to be a sell signal bar on the daily chart. They hope the rally is just a wedge buy climax and a test of the top of the 2 month range. The bears have been selling rallies overnight, but have been unable to make more than a scalp. They will try to get today to close below the open. Today would then have a bear body and be a better sell signal bar on the daily chart.
So far, the bars and legs today have been small. Day traders have only been scalping. Because the daily chart is at a critical location, there is an increased chance of a surprisingly big move up or down. However, the odds favor a continuation of the quiet trading and small range.
Summary of today’s S&P Emini futures price action and what to expect tomorrow

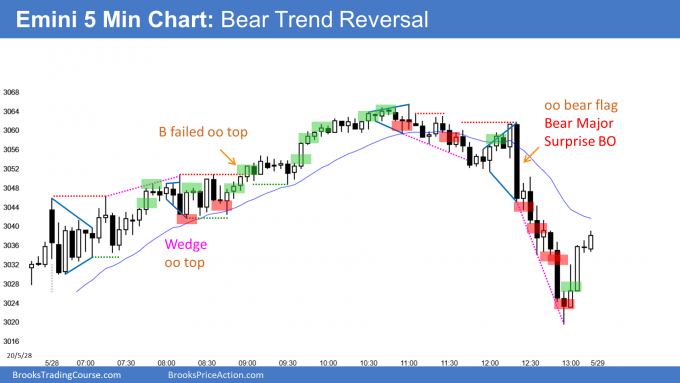
Here are several reasonable stop entry setups for today. I show each buy entry with a green rectangle and each sell entry with a red rectangle. I rarely also show limit order entries and entries on the close of bars. I do not want the lines to be distracting. If they are longer, I make them dotted. But, they have to be visible, so I make the shorter ones solid. Buyers of the Brooks Trading Course and Encyclopedia of Chart Patterns have access to a much more detailed explanation of the swing trades for each day (see Online Course/BTC Daily Setups).
My goal with these charts is to present an Always In perspective. If a trader was trying to be Always In or nearly Always In a position all day, and he was not currently in the market, these entries would be logical times for him to enter.
If the risk is too big for your account, you should wait for trades with less risk or trade an alternative market like the Micro Emini.
End of day summary
After a trading range open, the Emini rallied in a bull channel today. It got back above 3044.25, which is 10% down from the high. It therefore was no longer in correction territory. However, it collapsed back to that price, which was near today’s open, in the final hour.
Today was a reversal day on the daily chart. It is therefore a sell signal bar. However, the bears took profits into the close and today had a prominent tail below on the daily chart.
Remember, the Emini is in the Sell Zone. I went short today and I plan to scale in higher. The rally might reach the March 3 high before the reversal down begins. The Emini should retrace about half of the 2 month rally before making a new all-time high.
Traders are paying attention to that 10% pullback level. It is therefore a potential magnet tomorrow.
Tomorrow is the end of the week and of the month. Both charts are bullish. But there is often profit taking just before a closes. Therefore, there is an increased chance of at least a small reversal down tomorrow, especially in the final hour. Also, after 2 strong days up, tomorrow will probably not be a strong bull day.
See the weekly update for a discussion of the price action on the weekly chart and for what to expect going into next week.
Trading Room
Traders can see the end of the day bar-by-bar price action report by signing up for free at BrooksPriceAction.com. I talk about the detailed S&P Emini futures price action real-time throughout the day in the BrooksPriceAction.com trading room. We offer a 2 day free trial.
Charts use Pacific Standard Time
When I mention time, it is USA Pacific Standard Time (the Emini day session opens at 6:30 am PST, and closes at 1:15 pm PST). You can read background information on the intraday market reports on the Market Update page.
Sir, suppose in a bear trend, does a HL MTR will have a more stronger trend than LL MTR, is it a common market behavior? And in a bear trend, suppose a two-legged pullback, the 2nd leg’s High is below the 1st leg’s high, does this is more bearish then the 2nd leg’s High is above 1st leg’s high.
That is a common question. I think any pattern can be as strong as any other pattern. It depends on context and how strong the bars are. Some traders prefer lower low buys and higher high sells, but the math is the same for any reversal. Context and the strength of the bars are very important.
Dear Al,
For the first 5 trades on scalping the Emini (B,B,S,B,S) will probably result in a loss if not quick enough. Is this how scalpers do all days until a trend happens to make substantial profits? Its take a lot of encouragement (difficulty) to take all these trades, assuming just trading 1 or 2 contracts (additional one for scale in), how much capital is needed (to cover frequent loss)?
Thanks.
Scalpers take a lot of trades, but only ones that they feel are good for their style of trading. Some only want stop order entries. If there is a trading range open, they will wait.
Others are comfortable with limit order entries. When there is a trading range open, they can make a lot of money. Buying below a bar and selling above a bar is the best choice when the market is in a tight range.
Most traders should only be entering with stop orders. They have to become comfortable with waiting.
Buffet stressed the importance of patience when he said, “A man can’t get a baby in one month by getting 9 women pregnant.”
Hi Al,
I’m planning to buy put spread when it’s close to 3100, do you think Mid-July is an OK expiration date for the put spread? Thank you.
The NFA does not allow me to make comments that can be viewed as providing individual trading advice. My general rule is to pick an expiration that is at least 2 – 3 times as long as I think I will need.
As an example, if I am looking at a trade that I might hold for a week, I would pick an option that expires in 6 or 7 weeks. If I think I might have to hold an option for 3 weeks, I would be buying one that expires in at least 2 months. Options that expire further out are more expensive, but the decay is less. Decay can be a problem if you end up holding the option longer than you expected.
An alternative to buying puts is to buy inverse ETFs that have big daily volumes and are not too expensive. There are many that have 2 – 3 times leverage. These include the SDS, SPXU, QID, FAZ, and VXX.
Hey Al,
Could you speak to the math for the low 1 short below 69 I took it with a stop above the big bear surpise bar with a target of open of the day. The risk may have been a little less then reward. Was this the correct profit target?
Reversal days in general target the opposite extreme or other support and resistance near that price. It was reasonable to look for a test of the open, the 60 minute EMA, and 3044.25, which is back in correction territory.
Bar 69 was the bull reversal bar. Good for you if you were quick enough to sell as 70 fell below it, seeing an outside down bar forming just after an outside up bar.
If you are talking about 70, the big bear bar, once 71 went below it, there was at least a 60% chance of a measured move down before a stop above the bar was hit. That math is fine. When reward = risk and probability is 60%, you have an edge.
Thanks yes that’s what I meant, I’ll have to review the videos on initial an actual risk again it makes sense when I watch them it’s different thinking about it in the heat of the moment