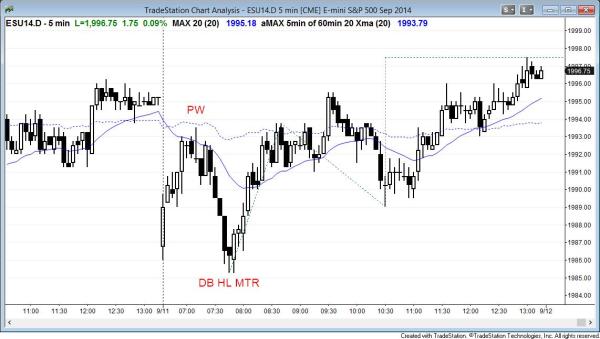
The rally on the open formed a lower high major trend reversal of yesterday’s bull channel. The Emini then sold off and formed double bottom with the open. The reversal up was a higher low major trend reversal of the 3 day bear trend.
End of day comments about today’s Emini price action and day trading
The Emini reversed down on the open at the moving average, but then reversed up sharply from the low of the day. This was a double bottom higher low major trend reversal after yesterday’s breakout above a 3 day bear channel, which is a bull flag. It formed a wedge bull flag at 11:00 a.m. and rallied to a new high of the day. By going above yesterday’s high, it broke out of the bear channel and stopped the 3 day pattern of lower highs and lows. The next target is the September 5 lower high. The bears will try hard to create a double top. If the bulls can break above it, then their chances of a bull breakout above the 3 week trading range go up.
Although the Emini candle on the daily chart is a bull trend candle (opening on its low and closing on its high), the 5 minute chart showed much more two-sided trading.
S&P500 Emini intraday market update for price action day traders
Time of update 7:43 a.m. PST.
The Emini is having a lower high major trend reversal. It opened in the middle of yesterday’s range and rallied to the moving average. It stalled with a parabolic wedge. Day traders see the price action as sideways and are scalping, buying low, selling high. The bulls want the rally to be a higher low major trend reversal of the 3 day bear trend. The bears want the rally to the moving average to be a lower high major trend reversal from yesterday’s bull trend.
When both the bulls and bears have reasonable arguments, the market usually is in a trading range. Day traders are hoping for a breakout up or down. The range is at least half of an average day’s range. This increases the chances that any breakout will be followed by a few bars, and then another range, forming a trending trading range day.
The bears are currently having a breakout to a new low of the day. The Emini is always in short. Parabolic wedge tops that lead to a new low often have a small final flag and then a bull reversal. This can lead to an endless pullback in the form of a bull channel. This breakout is strong enough to have at least a little more down and it might become a bear trend day. If so, a trending trading range day is likely. The breakout is strong enough so that it might form a spike and channel bear trend. Bulls will try to create the reversal up, but until there is evidence of this, traders will look to sell.
S&P500 Emini 60 minute, daily, weekly, and monthly candle charts
The Emini has been in a trading range for 3 weeks. When it fell below last week’s low, it triggered a short on the weekly chart, forming a failed breakout above the July high.
It also triggered a 60 minute lower high major trend reversal short. The 60 minute breakout was small and the pullback was deep. The bull hope that the lower low is just a bear channel, which is a bull flag. They are buying, looking for a bull breakout of the bull flag, and then a rally to a new high. From there, they want a measured move up.
The bears wand the breakout to be the start of a bear channel. They want an endless pullback where the Emini looks like it is in a slightly downward sloping trading range. At some point, the bulls give up. They stop scaling in and sell out of their longs. This creates a big bear breakout, which becomes either a breakout gap or a measuring gap.
Until there is either a bull or breakout of the 60 minute bull flag (bear channel), the stock market is neutral.
The monthly chart is extremely overbought and will likely have a 100 – 200 point pullback within the next several bars. Everyone knows that September often has a selloff, but no one yet knows if it has begun. We need more information, in the form of a strong breakout. Until then, the weekly and monthly bull trends are intact.
See the weekly update for a discussion of the weekly chart.
Traders can see the end of the day bar-by-bar price action report by signing up for free at BrooksPriceAction.com. I talk about the detailed Emini price action real-time throughout the day in the BrooksPriceAction.com trading room, and a 2 day free trial is available.
When I mention time, it is USA Pacific Standard Time (the Emini day session opens at 6:30 am PST, and closes at 1:15 pm PST). You can read background information on the intraday market reports on the Intraday Market Update page.