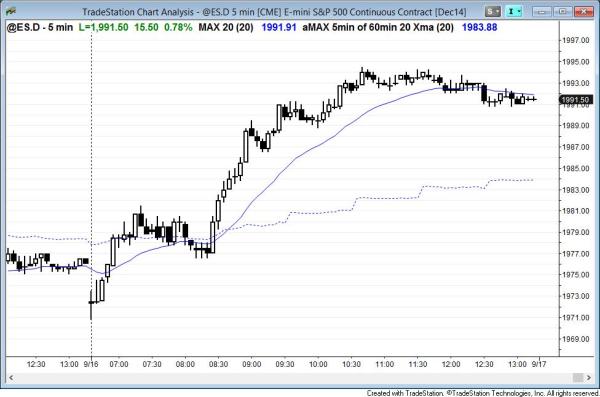
The Emini had a trend from the open bull trend.
End of day comments about today’s Emini price action and day trading
The Emini reversed up from a higher low major trend reversal that formed over two days. Today’s low was a double bottom with the first entry, which formed at 9:05 a.m. yesterday. At 8:30 a.m. today, the Emini had a strong breakout above the top of the two day trading range. It rallied above a 60 minute lower high, converting the bear channel back into a 60 minute trading range.
The Emini entered a tight trading range in the middle of the day and formed a lower high major trend reversal within the tight trading range. However, the bear breakout at the end of the day was small, and the follow-through was bad. The 12:40 p.m. bar’s high was below the moving average and this created a moving average gap bar buy signal. The rally that follows often becomes the final bull leg, and then the market tries to reverse down into a major trend reversal. There was not enough time left to accomplish this and it might take place tomorrow.
S&P500 Emini intraday market update for price action day traders
Time of update 7:16 a.m. PST.
The Emini opened within yesterday’s trading range and rallied strongly from above yesterday’s low, creating a bull trend. It formed a higher low major trend reversal on the first bar, and then a trend from the first bar bull trend. The reversal up was strong enough so that it might control the day. The rally went 9 points above the open, which would create a 9 point tail if today were to become a bear trend day. That would be very unusual, although possible. Unless the bears can clearly strongly reverse the market, traders should look for buy setups. If the day enters a trading range, day traders can take scalps in both directions.
As I write at 7:20 a.m., the bears are trying to reverse the rally. However, the rally was strong enough to make the odds favor a trading range or bull trend rather than a reversal. Bears looking for swing shorts should wait for a strong bear breakout with follow-through. Without this, shorts are only scalps.
S&P500 Emini 60 minute, daily, weekly, and monthly candle charts
The FOMC meeting results come tomorrow at 11 a.m., PST. Because the Emini is so overbought and might be at the top of a developing trading range, the bulls and bears are both heavily committed. One side will soon find itself holding a losing position. The breakout can be fast and big, and it could last several months. Since the Emini is so overbought, the odds favor a transition into a trading range on the weekly chart. The first target is 1900. Even if there is a bull breakout on the report, the odds still favor a move down to 1900, which means that the bull breakout, no matter how strong, will probably fail.
The 60 minute chart has been pulling back for a couple of weeks. The bulls see this bear channel as a bull flag and want a bull breakout and a new all-time high. However, this is a potential endless pullback in a bull trend. Bears will watch for a downside breakout with follow-through. If they see a couple of big consecutive bear trend bars, they will short for a measured move down. They want a bear breakout below a bull flag.
The top of the weekly channel is now around 2,030. Since the rally in early September turned down without reaching the trend channel line, it is now less likely that the Emini will get there without more of a pullback. The minimum logical pullback target is the August low.
See the weekly update for a discussion of the weekly chart.
Traders can see the end of the day bar-by-bar price action report by signing up for free at BrooksPriceAction.com. I talk about the detailed Emini price action real-time throughout the day in the BrooksPriceAction.com trading room, and a 2 day free trial is available.
When I mention time, it is USA Pacific Standard Time (the Emini day session opens at 6:30 am PST, and closes at 1:15 pm PST). You can read background information on the intraday market reports on the Intraday Market Update page.