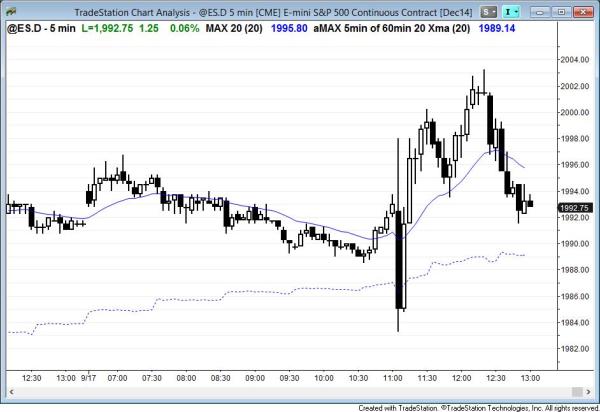
This chart is from just before the close. The FOMC report at 11 a.m. created the dominant price action feature of the day. It led to big reversals up and down, but it again failed to hold above 2,000.
End of day comments about today’s Emini price action and day trading
The dominant feature today was the reaction to the 11 a.m. FOMC report. The Emini rallied, sold off 14 points, rallied 17 points, and then continued to reverse into the end of the day. These three moves set the tone of trading range price action for the rest of the day. The Emini failed many times at 2,000 over the past month and today is another example. It might have to go lower, like maybe to 1,900, to find buyers because there does not appear to be enough up here to get the breakout above 2,000.
Key support was the open of the day. The bears hoped for a doji day instead of a bull trend day. Resistance was the all-time high. Bulls wanted a close above the prior all-time high and well above the open of the day.
S&P500 Emini intraday market update for price action day traders
Time of update 8:04 a.m. PST.
The Emini had a trading range open, with small bars and many reversals. There was not much selling pressure in yesterday’s tight trading range. This increased the chances of some bull trend resumption today, but it also increased the chances that the resumption would be limited. The Emini reversed down from a higher high major trend reversal, but the selloff lacked consecutive big bear bars closing on their lows. This is more common in bear legs within trading ranges, and less common in bear trends. So far, the day is a trading range day. Until there is a strong breakout up or down, traders will buy low, sell high, and scalp.
The FOMC report at 11:00 a.m. will be lead to the dominant price action feature of the day, even if there is a strong trend earlier. On FOMC days, the market usually enters a tight trading range before the report. The range can be small, like 5 to 10 bars before, or large, lasting for several hours. The probability is not good for entering on a stop when the report comes out. It is usually easier to make money if a trader waits for at least 2 – 3 bars to see if the breakout will continue or reverse.
S&P500 Emini 60 minute, daily, weekly, and monthly candle charts
The Emini reversed up strongly from the daily moving average yesterday and closed above the highs of the past 4 days. This buying pressure is a sign of strength, but it is still in the month long trading range. The weekly chart is trying to create a small bull flag (a high 1 breakout pullback buy setup after the breakout above the July high).
It also broke above the 60 minute bear channel by going above a prior 60 minute lower high. The FOMC report at 11:00 a.m. today will probably lead to a big breakout up or down, or both.
See the weekly update for a discussion of the weekly chart.
Traders can see the end of the day bar-by-bar price action report by signing up for free at BrooksPriceAction.com. I talk about the detailed Emini price action real-time throughout the day in the BrooksPriceAction.com trading room, and a 2 day free trial is available.
When I mention time, it is USA Pacific Standard Time (the Emini day session opens at 6:30 am PST, and closes at 1:15 pm PST). You can read background information on the intraday market reports on the Intraday Market Update page.