Emini and Forex Trading Update:
Thursday August 1, 2019
I will update again at the end of the day.
Pre-Open market analysis
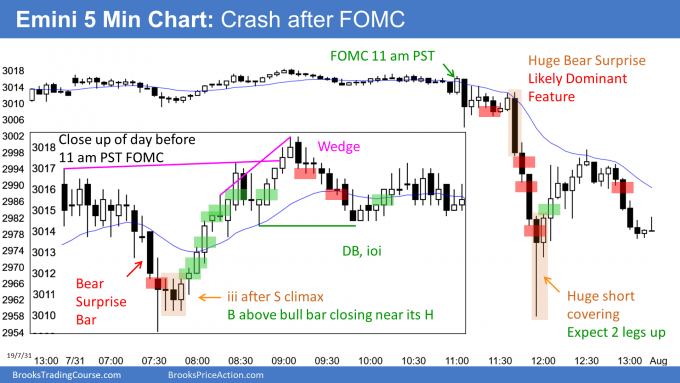
The Emini crashed on the 5 minute chart yesterday after the FOMC announcement, but reversed up and undid much of the selling. It has been oscillating around 3,000 for a month, and yesterday’s bounce failed near that magnet.
Since this week traded below last week’s low, this week is now a pullback in an 8 week bull micro channel. However, the 8 week rally had bear bars and small bars on the weekly chart. It was a weaker rally than the January micro channel. Therefore, the pullback will probably last at least another week or two.
I have been saying that the Emini would selloff to 2900 – 2950 within a couple weeks. Yesterday’s low of 2957 might be all that the bears get. More likely, there will be at least a small 2nd leg sideways to down down within a few days.
August should trade below the July low and test around 2900. Even if the selloff is deeper, the odds still favor a new high later this year.
Yesterday’s selloff was in part due to options trading
It is important to understand that about half of yesterday’s selloff was caused by options trading firms. As the stock market falls, the value of short puts increases at an increasing rate. This is the gamma. The option selling firms have to offset their risk by selling stocks and futures. This increases the collapse. Once they are fully hedged, the selling stops, and the bears buy back their shorts. Yesterday was an example of a strong short-covering rally after a gamma-related crash.
After yesterday’s Big Down, Big Up, there is now Big Confusion. The Emini might go sideways for a day or two before deciding whether to resume up or continue down. At the moment, the odds still favor 2 – 3 weeks down to 2900.
Options related selling
I posted this just before the close yesterday and I am repeating it here.
The Emini crashed after the Fed rate cut, but reversed up violently to around 3,000. About half of the selling was caused by the gamma in options. Hedge funds and institution hedge their stock positions in many ways.
A common way is to buy puts. For them to buy puts, other firms have to sell puts. There are huge option firms that specialize in selling puts and calls. They are essentially selling insurance to all of the firms that buy stocks.
When the stock market goes down, the firms that buy puts have their losses partially offset by the puts that they bought. These puts increase in value. That means that the options selling firms that sold the puts are losing money on their short puts.
The rate of loss accelerates as the stocks fall. It is not linear. Gamma measures how fast option prices change with the change in stock price. The gamma becomes big during a quick selloff.
That increasing gamma means that the options selling firms are losing money at an increasing rate. When the gamma rises, option selling firms have to reduce their risk. One way to to short stocks. If they short enough, the risk of a further drop in the stock market will not create additional losses for them. What they lose from their short puts, they make from their short stocks and futures.
When there is a big down day like today, about half of it is due to fundamentals, like the bulls taking profits and the bears shorting. The other half is created by option selling firms protecting themselves from losses on the puts they sold. Therefore, a big down day is actually not as bearish as it looks.
Overnight Emini Globex trading
The Emini is up one point in the Globex session. After yesterday’s huge reversal up, the Emini will probably be in a trading range today. It could go sideways for several days.
Furthermore, yesterday’s range was extremely big. Today will open at least 20 points above yesterday’s low and probably not break below yesterday’s low. That will make today an inside day.
Trading ranges have legs up and down. Since yesterday’s range was so big, the legs today will probably be big enough for swing trades.
While a trend day up or down is always possible, yesterday’s Big Down and Big Up created Big Confusion. Confusion typically leads to a trading range.
Yesterday’s setups

Here are several reasonable stop entry setups from yesterday. I show each buy entry with a green rectangle and each sell entry with a red rectangle. I rarely also show limit order entries and entries on the close of bars. Buyers of the Brooks Trading Course and Encyclopedia of Chart Patterns have access to a much more detailed explanation of the swing trades for each day.
My goal with these charts is to present an Always In perspective. If a trader was trying to be Always In or nearly Always In a position all day, and he was not currently in the market, these entries would be logical times for him to enter.
EURUSD Forex market trading strategies

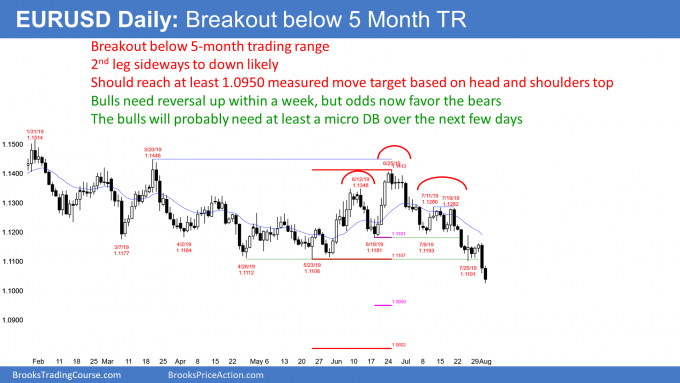
The EURUSD daily Forex chart had a big bear trend bar yesterday and it closed far below the 5 month trading range. That is a Bear Surprise Bar, which typically has at least a small 2nd leg sideways to down. This is therefore likely to be a successful bear breakout. Success means at least a couple legs down to a measured move target.
Yesterday could be a measuring gap. A measured move down based on the height of the 5 month trading range is 1.0802. The measured move target based on the July 23 breakout below the head and shoulders top is at 1.0950.
If today remains a big bear trend day and it closes near its low, the probability of reaching the lower target goes up. But if today closes above its midpoint, the probability of reaching the lower target will be less.
Can the bear breakout fail?
Traders have to remember that the opposite of what is likely always has at least a 40% chance of happening. Therefore, there is a 40% chance that this breakout will fail.
For example, if the daily chart goes sideways for a few days and forms a micro double bottom, the bears will begin to take profits. If the profit taking is strong, traders will conclude that the bears are giving up and that the bulls are taking control. The result could be a failed breakout and a reversal up to the middle or top of the 5 month range over the next couple months.
The bulls want today to close above the midpoint. If they can get today to close at the high, it would reduce the chance of a successful breakout on the daily chart. While a 2nd leg would still be likely, it would probably be smaller. Furthermore, it might be more sideways rather than down.
Overnight EURUSD Forex trading
The EURUSD 5 minute chart sold off strongly late yesterday after the FOMC announcement. That was a spike down. The selling continued since then in a bear channel. This is a Spike and Channel Bear Trend.
A channel is a weaker bear trend. Bears are beginning to wait for rallies before selling. They are no longer willing to sell at the low.
Traders expect the channel to transition into a trading range today. Once it becomes a trading range, the bulls will look for reversals up. The channel has been broad enough for the bulls to make several 10 pip scalps overnight.
While the bulls would like a major trend reversal up, the best they probably can get today is a rally to the start of the channel at around 1.1060.
Summary of today’s S&P Emini futures price action and what to expect tomorrow

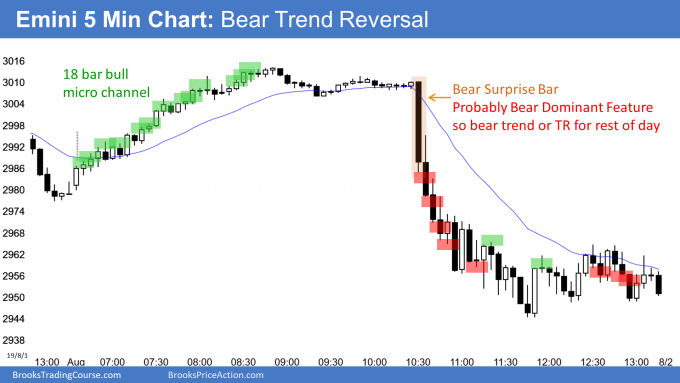
Here are several reasonable stop entry setups for today. I show each buy entry with a green rectangle and each sell entry with a red rectangle. I rarely also show limit order entries and entries on the close of bars. Buyers of the Brooks Trading Course and Encyclopedia of Chart Patterns have access to a much more detailed explanation of the swing trades for each day.
My goal with these charts is to present an Always In perspective. If a trader was trying to be Always In or nearly Always In a position all day, and he was not currently in the market, these entries would be logical times for him to enter.
End of day summary
The Emini rallied in a 19 bar bull micro channel on the open. The rally continued to above yesterday’s sell climax high.
After going sideways for more than an hour, it crashed again, like yesterday. It fell below yesterday’s low and the July low. Yes, the crash was news related, but it could not have happened if the market was not already looking for an excuse to selloff. I have been talking about this for 2 weeks. The buy climaxes on the daily and weekly charts are the excuse.
It is important to remember that there is an oo buy signal on the monthly chart. There is therefore a 60% chance of sideways to up trading into September. Consequently, even though the Emini will probably be sideways to down for another couple of weeks and test 2900, it should then make a new high.
See the weekly update for a discussion of the price action on the weekly chart and for what to expect going into next week.
Trading Room
Traders can see the end of the day bar-by-bar price action report by signing up for free at BrooksPriceAction.com. I talk about the detailed S&P Emini futures price action real-time throughout the day in the BrooksPriceAction.com trading room. We offer a 2 day free trial.
Charts use Pacific Standard Time
When I mention time, it is USA Pacific Standard Time (the Emini day session opens at 6:30 am PST, and closes at 1:15 pm PST). You can read background information on the intraday market reports on the Intraday Market Update page.
Dear Professor,
I have a question regarding the EURUSD.
If hypothetically the “Big Suprise Bar” at the daily chart does not closes under the 5 month trading range, it will be correct to say that it is a sell climax (the bigger bar after 3 pushes down of a trend lasting around 20 daily bars)?
This is what is currently happening at the EURUSD Futures and I just wanted to know if I am missing the context.
Best Regards,
Josep.
Every trend bar is a breakout and a climax. Traders need to see the follow-through to decide on the probability of the start of a trend or a failed breakout and a reversal. That is currently going on with the daily chart. I talked more about this in my post today (Friday).
Thank you very much for your response Professor, it is much appreciated. I see it more clear now.
Have a lovely weekend.
Kr,
Josep.
Without the Trump tweet the market would likely have gone where it went but over a longer period of time. Mostly I think news adds acceleration more than outright change.
Oh, thanks AL
Hello Al,
I’ve been having consistent trades when there is no Donald Trump ego threats. Today, I was hit with a big loss when Trump tweeted new tarrifs on China. Do you believe the big move today would have happened if Trump had kept his mouth shut? I did not see any big resistance to the trading range.. price was moving sideways to up around 13:00 EST. Thank you for sharing your insight. You are the reason I am more consistent in my trading. Thanks again-Richard