Emini and Forex Trading Update:
Wednesday August 7, 2019
I will update again at the end of the day.
Pre-Open market analysis
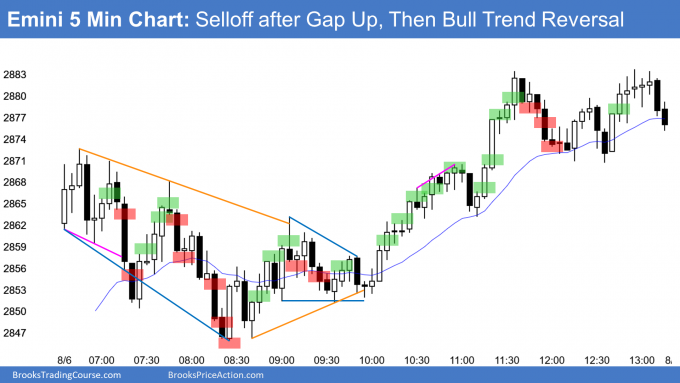
After a 4 day sell climax to below support, the Emini yesterday had a big gap up above Friday’s close. It sold off for a couple hours, but then reversed back up and closed near the high to form a bull bar on the daily chart. It was an inside bar and therefore it is a buy signal bar for today.
In addition, an inside bar is also a sell signal bar for a Low 1 bear flag. But the bull body means it is a weak sell signal bar. Traders expect that there will be buyers not far below yesterday’s low.
After a 4 day collapse and then a big reversal up, there is confusion. Is the short covering rally a pullback in a bear trend or a resumption of the bull trend? Confusion typically leads to sideways trading, which is likely for the next several days. This is true even with the huge moves down and up.
The Emini will probably be mostly sideways for several days. It might even test of the June low before resuming up to the all-time high. The odds still favor a new all-time high within a couple months.
Overnight Emini Globex trading
The Emini traded above yesterday’s high on the daily Globex chart overnight, but then reversed down 40 points over the past hour. It is now testing yesterday’s low. Since a trading range for a few days is likely, traders will look for reversals.
However, the daily ranges have been big. Even if there is a trading range day, the legs up and down will be big enough for swing trades. Day traders will look for 10 point moves instead of the 4 point moves that they expect during most days.
Since yesterday was an inside day, it might be the start of several sideways days. If so, day traders today will look for reversals from around the prior day’s high or low.
Yesterday’s setups

Here are several reasonable stop entry setups from yesterday. I show each buy entry with a green rectangle and each sell entry with a red rectangle. I rarely also show limit order entries and entries on the close of bars. Buyers of the Brooks Trading Course and Encyclopedia of Chart Patterns have access to a much more detailed explanation of the swing trades for each day.
My goal with these charts is to present an Always In perspective. If a trader was trying to be Always In or nearly Always In a position all day, and he was not currently in the market, these entries would be logical times for him to enter.
EURUSD Forex market trading strategies

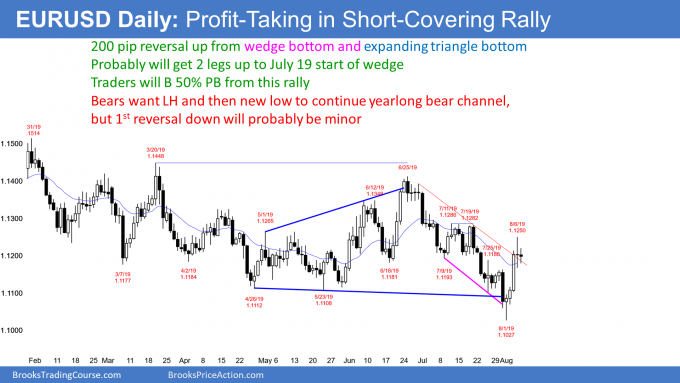
The EURUSD daily Forex chart rallied strongly for 4 days back to the middle of its 5 month trading range. The rally reduces the chance of a strong selloff to far below the August low within the next several weeks. Big Down, Big Up creates Big Confusion. When there is confusion, traders look for reversals. The result is a trading range, which is likely over the next week.
The rally was strong enough to make a 2nd leg up likely after a 3 – 5 day selloff. Bulls will look to buy a pullback to around the August 1 buy signal bar high and bottom of the April/July trading range or a 50% retracement of the rally.
Yesterday was a big doji bar on the daily chart. It represents profit-taking from the bulls. It is also a sign that the bears are beginning to sell again.
Since it was a big bar that opened and closed in the middle, it represents balance. Today so far is another doji day. Furthermore, it is within yesterday’s range. It again is a trading range day. The tails at the top and bottom of the bar on the daily chart tell traders that everyone is buying low, selling high, and taking quick profits.
Overnight EURUSD Forex trading
The EURUSD 5 minute Forex chart rallied to below yesterday’s high, sold off to above yesterday’s low, and rallied back to yesterday’s close. The 3 legs are within a 40 pip range. Traders expect that the remainder of the day will probably remain mostly within the overnight range. Day traders will likely scalp around yesterday’s close, which is also around today’s open.
Since a 2 – 5 day pullback is likely within a few days, the bears will try to get a bear bar on the daily chart today or tomorrow. While the bulls would prefer a close near the high and a test of the July 19 high, the 4 day rally was climactic. Consequently, a test down is likely first.
Summary of today’s S&P Emini futures price action and what to expect tomorrow

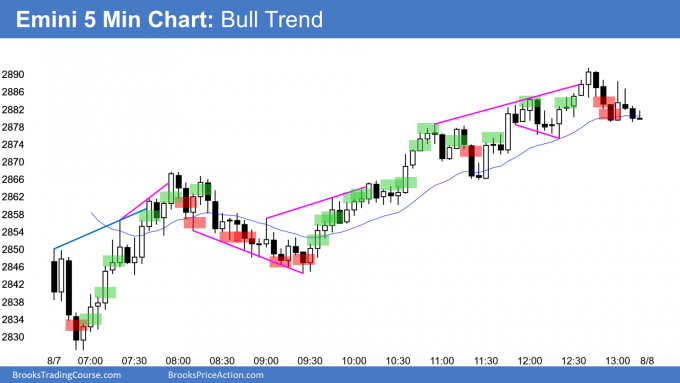
Here are several reasonable stop entry setups for today. I show each buy entry with a green rectangle and each sell entry with a red rectangle. I rarely also show limit order entries and entries on the close of bars. Buyers of the Brooks Trading Course and Encyclopedia of Chart Patterns have access to a much more detailed explanation of the swing trades for each day.
My goal with these charts is to present an Always In perspective. If a trader was trying to be Always In or nearly Always In a position all day, and he was not currently in the market, these entries would be logical times for him to enter.
End of day summary
The Emini reversed up from a test of Monday’s sell climax low. By trading below yesterday’s low and then above its high, the Emini formed an outside up bar today. It is a buy signal bar on the daily chart. The bulls also have a micro double bottom with Monday’s low. In addition, they are trying to create a bull buy signal bar on the weekly chart.
While the odds favor higher prices over the next 2 months, the selloff was exceptionally strong. Therefore a trading range for a couple weeks is more likely than an immediate resumption of the bull trend.
See the weekly update for a discussion of the price action on the weekly chart and for what to expect going into next week.
Trading Room
Traders can see the end of the day bar-by-bar price action report by signing up for free at BrooksPriceAction.com. I talk about the detailed S&P Emini futures price action real-time throughout the day in the BrooksPriceAction.com trading room. We offer a 2 day free trial.
Charts use Pacific Standard Time
When I mention time, it is USA Pacific Standard Time (the Emini day session opens at 6:30 am PST, and closes at 1:15 pm PST). You can read background information on the intraday market reports on the Intraday Market Update page.
Was this morning’s drop enough to qualify as a second leg down?
Yes, it meets the minimum objective of a clear test of Monday’s close and low. However, the selloff was so strong that there probably will be another leg down after a 2 – 3 week rally. As an example, look at the daily chart in 1987. There was a test of the low a week after the crash and then another 6 weeks later.
Does it make it a second leg on the daily chart? Isn’t it the confirmation of H1 first leg?