Emini and Forex Trading Update:
Wednesday February 19, 2020
I will update again at the end of the day.
Pre-Open market analysis
The Emini has been in a Small Pullback Bull Trend for 3 weeks. Yesterday was a 1 day pullback. It is High 1 bull flag buy signal bar for today.
However, the Emini has stalled below the 3400 Big Round Number for 6 days. Also, yesterday was not a big bull bar closing on its high. In addition, the 3 week rally is forming a small wedge and that will likely lead to a pullback soon.
While the Emini might get a brief break above 3400 within a couple weeks, it will probably test the February 10 buy climax low by mid-March. Also, there is a 50% chance of a test of the January low by the end of March.
Emini stalling at the 3400 Big Round Number
The bulls want a strong break above the 3400 Big Round Number. However, the parabolic wedge rally on the daily chart and the 4% selloff in January make it equally likely that the 3 week rally is just a bull leg in a trading range that began around Christmas.
The Emini stalled for 4 days just below 3300 last month. It then broke above, but could not hold above. January then had a 4% selloff.
The current behavior is similar. At a minimum, the Emini will probably fall to the February 10 buy climax low within a couple weeks. But will it first break above 3400? We should find out over the next few days.
Overnight Emini Globex trading
The Emini is up 9 points in the Globex session. It has been in a tight range for 5 days. Most days have had at least one reversal. Since markets tend to continue what they have been doing, traders will expect at least one reversal today as well.
A tight trading range is a Breakout Mode pattern. The probability of the bull breakout is about the same as for a bear breakout. Traders are looking for a breakout. Therefore, there is an increased chance of a strong trend within the next few days. However, until one is clearly underway, day traders will continue to look for reversals.
Yesterday’s setups

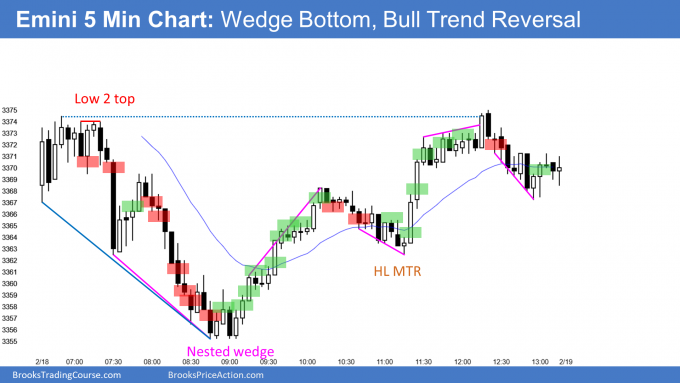
Here are several reasonable stop entry setups from yesterday. I show each buy entry with a green rectangle and each sell entry with a red rectangle. I rarely also show limit order entries and entries on the close of bars. Buyers of the Brooks Trading Course and Encyclopedia of Chart Patterns have access to a much more detailed explanation of the swing trades for each day.
My goal with these charts is to present an Always In perspective. If a trader was trying to be Always In or nearly Always In a position all day, and he was not currently in the market, these entries would be logical times for him to enter.
If the risk is too big for your account, you should wait for trades with less risk or trade an alternative market like the Micro Emini.
EURUSD Forex market trading strategies

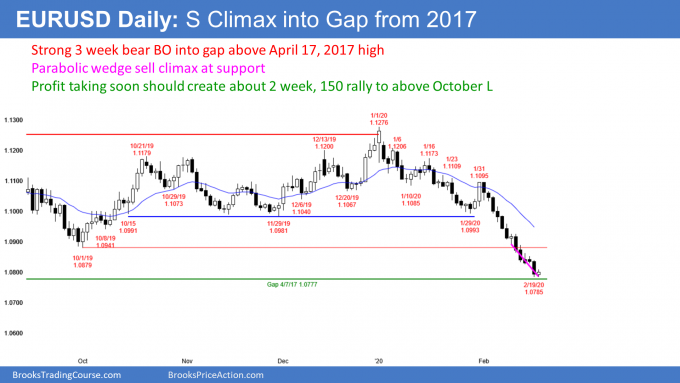
The daily chart of the EURUSD Forex market has sold off strongly for 3 weeks. It is now in the gap above the April 7, 2017 high, which is an important support level. Was this selloff simply a test of that gap, or will it break below the 2017 low and continue down to par (1.00)?
The stop for the bears is now far above. To reduce risk, many will begin to take profits. A short covering rally after an extreme sell climax typically has 2 or more legs and lasts about 10 bars or more.
Today is the 3rd attempt in 7 days to stop the selling. There is therefore a parabolic wedge bottom, which often comes at the end of a sell climax.
If the bulls can get today to close near its high, today will be a reasonable buy signal bar for tomorrow. A break above a strong buy signal bar will make many bears take some profits.
In addition, bull scalpers will buy for a test up to above the most recent resistance. That is the October low. The rally also usually tests the 20 day EMA.
Overnight EURUSD Forex trading
The 5 minute chart of the EURUSD Forex market fell 1 pip below yesterday’s low and reversed up. So far, the reversal has only been 15 pips.
Everyone knows that the odds favor profit taking soon. The bears want the trend to continue much lower before it begins.
However, the daily chart is at major support. Also, there is now a possible parabolic wedge sell climax on the daily chart. That often leads to a minor reversal up.
Consequently, the next few days are important. If the bears begin to buy back their shorts and the bulls start to buy for a bounce, today could have a bull body. That would be a possible low for the next couple weeks.
Therefore, the bulls will be more willing to buy today than they have been for 3 weeks. At a minimum, they want today to have a bull body on the daily chart. They would have a better chance of a bigger rally if today or tomorrow becomes a big bull day that closes on its high.
The bears today will sell rallies. Their minimum goal is to have today close below the open. They do not want a good looking buy signal bar on the daily chart. If there are successful, traders will expect at least slightly lower prices tomorrow and possibly for several days.
Since the bears are exhausted and are ready to buy back their shorts at any point, there is a reduced chance of a big bear day today. This is true even though the daily chart is in a strong bear trend.
Summary of today’s S&P Emini futures price action and what to expect tomorrow

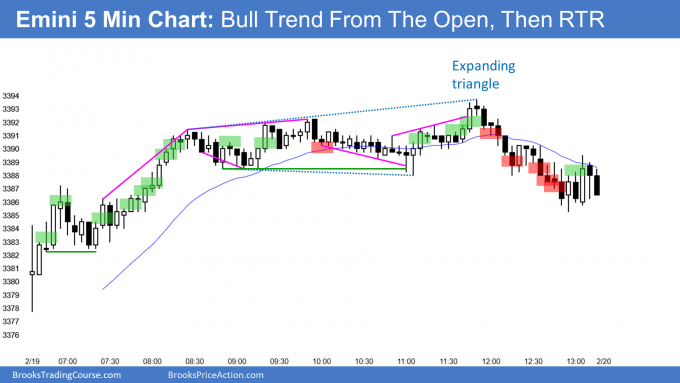
Here are several reasonable stop entry setups for today. I show each buy entry with a green rectangle and each sell entry with a red rectangle. I rarely also show limit order entries and entries on the close of bars. Buyers of the Brooks Trading Course and Encyclopedia of Chart Patterns have access to a much more detailed explanation of the swing trades for each day.
My goal with these charts is to present an Always In perspective. If a trader was trying to be Always In or nearly Always In a position all day, and he was not currently in the market, these entries would be logical times for him to enter.
If the risk is too big for your account, you should wait for trades with less risk or trade an alternative market like the Micro Emini.
End of day summary
The Emini rallied off the open and then entered a tight trading range. There was some trend resumption up after the FOMC minutes at 11 am PST. However, the Emini reversed back down to the middle of the range in the final hour from an Expanding Triangle top. Today was another trading range day.
The bulls want a strong break above 3400 and then a rally up to the 3468 Leg 1 = Leg 2 measured move target. However, there will probably be a reversal down to at least the February 10 buy climax low within the next few weeks. Then the bulls might try again.
See the weekly update for a discussion of the price action on the weekly chart and for what to expect going into next week.
Trading Room
Traders can see the end of the day bar-by-bar price action report by signing up for free at BrooksPriceAction.com. I talk about the detailed S&P Emini futures price action real-time throughout the day in the BrooksPriceAction.com trading room. We offer a 2 day free trial.
Charts use Pacific Standard Time
When I mention time, it is USA Pacific Standard Time (the Emini day session opens at 6:30 am PST, and closes at 1:15 pm PST). You can read background information on the intraday market reports on the Market Update page.
Al,
Just wondering about that ledge from yesterday down at the bottom of the day at 3355.25. How long usually does it take for the market to test that ledge again?
Thank you.
80% of the time, it gets there within 2 days, but sometimes takes a week. That ledge is less reliable because it is a pair of 2 bar reversals. That makes it a small double bottom and less of a ledge. A double bottom means 2 lows instead of 4. But the 2 month rally is still probably a leg in a developing trading range that began around Christmas, and therefore there should be a leg down within a couple weeks. You and I will remember the ledge once it gets hit.