Emini and Forex Trading Update:
Thursday September 10, 2020
I will update again at the end of the day.
Pre-Open market analysis
Today is rollover day for the Emini. Most traders will trade September today and switch to December tomorrow.
Yesterday reversed up strongly from Tuesday’s test of the July high. The bulls are hoping that the selloff has ended. Although there was a late selloff yesterday, they want a 2nd leg up today or tomorrow.
But even if they get it, traders expect a 2nd leg down to around 3000 -3200. They will look to sell a 2nd leg up to around 3450 – 3500.
What happens if today and tomorrow are huge bull days? The odds will shift back in favor of a new high rather than a selloff to 3200.
Weekly chart had weak sell setup
Over the weekend, I said that last week was an outside down bar on the weekly chart and it was at the resistance of the top of a 3 year channel. It was therefore a sell signal bar.
But I also said that it had a big tail below and that it closed above the low of the prior week. Finally, I wrote that there was an 8 bar bull micro channel. I concluded by saying that this was a weak sell setup and that there might be more buyers than sellers below last week’s low.
That does not mean that the bull trend will continue. Traders still expect a 2nd leg down on the daily chart. It simply means that the Emini might not fall sharply on the weekly chart. Instead, it might have to go sideways a little before it can go down. If this week is a bull bar on the weekly chart, it will increase the chance of more sideways trading next week before the Emini works down to at least 3200.
Overnight Emini Globex trading
The Emini is up 7 points in the Globex session. It is currently in the middle of yesterday’s 4 hour trading range.
Traders expect a 2nd leg sideways to up after the 3 day sell climax. They are currently deciding if the 4 hour trading range is the end of the pullback from the 1st leg up or if the Emini has to retrace more of the rally up from Tuesday’s low. In either case, the 2nd leg up will probably reach 3450 – 3500 within a few days.
If today opens within yesterday’s trading range, traders will expect some continuation of that range. Today would then have a trading range open. The bulls will look to buy a double bottom or wedge bottom for a swing up and the bears will look to sell a wedge rally or double top for a swing down.
About 20% of days have trends from the open, like yesterday. If there are 2 or 3 big trend bars on the open, especially if they break far above or below yesterday’s trading range, traders will expect a trend from the open. But because today is opening within yesterday’s range, day traders will look for early reversals.
Yesterday’s setups

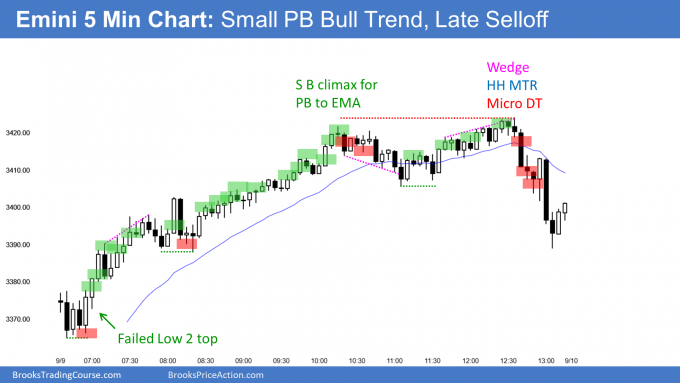
Here are several reasonable stop entry setups from yesterday. I show each buy entry with a green rectangle and each sell entry with a red rectangle. I rarely also show limit order entries and entries on the close of bars. I do not want the lines to be distracting. If they are longer, I make them dotted. But, they have to be visible, so I make the shorter ones solid. Buyers of the Brooks Trading Course and Encyclopedia of Chart Patterns have access to a much more detailed explanation of the swing trades for each day (see Online Course/BTC Daily Setups).
My goal with these charts is to present an Always In perspective. If a trader was trying to be Always In or nearly Always In a position all day, and he was not currently in the market, these entries would be logical times for him to enter.
If the risk is too big for your account, you should wait for trades with less risk or trade an alternative market like the Micro Emini.
EURUSD Forex market trading strategies

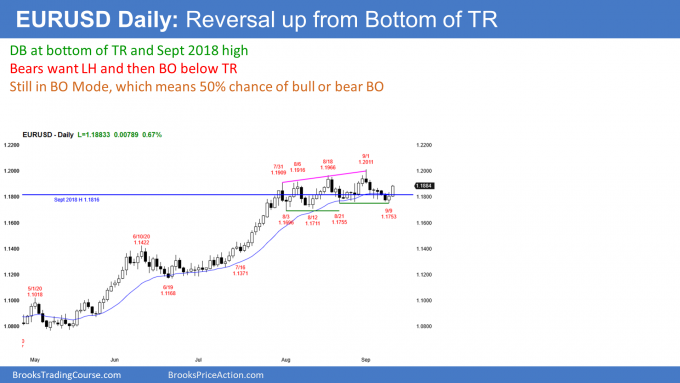
The EURUSD Forex market on the daily chart is reversing up from a double bottom in a 6 week trading range. It broke above the September 2018 high, and the reversal up is also from a test of that level.
However, it is still in a trading range, which means that it is in Breakout Mode. There is about a 50% chance of a successful breakout up or down. Traders are looking for reversals every few days and are unwilling to hold onto positions. They will continue to do that until there is a clear breakout.
Overnight EURUSD Forex trading
The EURUSD Forex market is reversing up from the bottom of a 6 week trading range. Yesterday was a buy signal bar. Today traded above yesterday’s high, which triggered the buy signal on the daily chart.
The EURUSD is currently at the high of the session on the 5 minute chart. The bulls want the day to close near its high and far above yesterday’s high. That would increase the chance of higher prices tomorrow.
The bears always want the opposite. They therefore would like today’s breakout to fail. That means they want today to close below yesterday’s high. Ideally, they want today to close on the low of the day. Today would then be a Low 1 sell signal bar on the daily chart for tomorrow.
Bull trend on the 5 minute chart
So far, the bulls have the advantage. The 5 minute chart has been consistently making higher highs and lows since today began. It is therefore in a bull trend.
It is now at the high of the session, but there was a big bull bar 15 minutes ago. That often will attract profit takers. If it does, it would probably result in a trading range for the next hour or two and possibly for the remainder of the day.
The bulls have already done all that they need to do on the daily chart. If today closes around where it is currently, traders will expect at least slightly higher prices tomorrow.
So far, day traders have only been buying, both for scalps and a swing up. If the 5 minute chart has a 20 – 30 pip pullback, day traders will conclude that the bull trend is evolving into a trading range. Day traders would then begin to sell reversals down for scalps, They will continue to buy, but will switch to buying pullbacks from buying at the market.
Can today reverse down? Yes, but the bears will probably have to first stop it from going up and create a trading range. The odds favor sideways to up for the rest of the day.
Summary of today’s S&P Emini futures price action and what to expect tomorrow

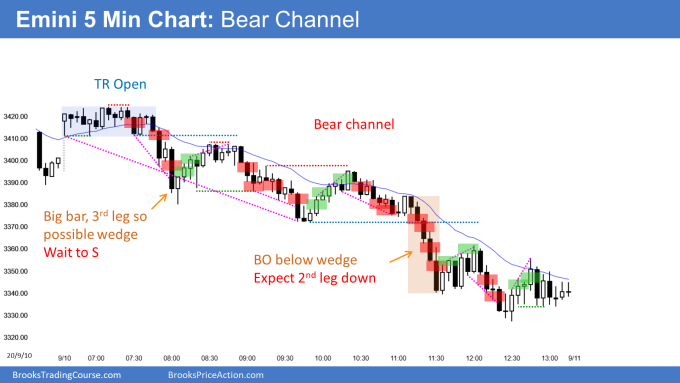
Here are several reasonable stop entry setups for today. I show each buy entry with a green rectangle and each sell entry with a red rectangle. I rarely also show limit order entries and entries on the close of bars. I do not want the lines to be distracting. If they are longer, I make them dotted. But, they have to be visible, so I make the shorter ones solid. Buyers of the Brooks Trading Course and Encyclopedia of Chart Patterns have access to a much more detailed explanation of the swing trades for each day (see Online Course/BTC Daily Setups).
My goal with these charts is to present an Always In perspective. If a trader was trying to be Always In or nearly Always In a position all day, and he was not currently in the market, these entries would be logical times for him to enter.
If the risk is too big for your account, you should wait for trades with less risk or trade an alternative market like the Micro Emini.
End of day summary
After a trading range open and a test of yesterday’s high, the Emini broke strongly to the downside. It sold off in a Spike and Channel Bear Trend to below yesterday’s low, last week’s low, the February high, and the open of the week.
Traders are deciding whether there will be a 2nd leg up after Wednesday’s rally, or if the Emini will just continue down to 3000 – 3200. Because the selloff on the 60 minute chart had many reversals, the bulls are willing to buy. That makes it likely that the Emini will try to get at least a small 2nd leg sideways to up before reaching the downside targets.
Tomorrow is Friday so weekly support and resistance can be important. The bears want a bear candlestick this week. They therefore want the week to close below the open of the week. Since last week was a sell signal bar, the bears want this week to close below last week’s low.
The bulls always want the opposite. They want this week to close above the week’s open, which would increase the chance of a bounce next week. However, the odds still favor a test of 3000 – 3200 before there is a new all-time high.
See the weekly update for a discussion of the price action on the weekly chart and for what to expect going into next week.
Trading Room
Traders can see the end of the day bar-by-bar price action report by signing up for free at BrooksPriceAction.com. I talk about the detailed S&P Emini futures price action real-time throughout the day in the BrooksPriceAction.com trading room. We offer a 2 day free trial.
Charts use Pacific Standard Time
When I mention time, it is USA Pacific Standard Time (the Emini day session opens at 6:30 am PST, and closes at 1:15 pm PST). You can read background information on the intraday market reports on the Market Update page.
Hi Al, can you explain why you didn’t you label bar 36 as a buy? I thought it was a reasonable buy considering it was a HL DB with bar 19, and a potential reversal from wedge. Also, if you did buy, would you have relied on a stop below bar 19 since a wide stop would be too risky because of the possibility of a bear channel and excessive profit taking over past few days? Many thanks!