Emini and Forex Trading Update:
Friday March 13, 2020
I will update again at the end of the day.
Pre-Open market analysis
The S&P500 now is in a bear market, like the Dow and the Nasdaq. The median size of the selloff in a bear market is 28%. It typically takes about a year to reach the final low and then another 2 years before there is a new high. Yesterday’s close on the cash index was 27% below the all-time high close. That is close enough to make traders think that the selloff might be over.
Traders believed that this selloff would test the December 2018 low. The overnight low was close enough to make traders believe that the test is satisfactory.
I have been saying this week that a 1 – 2 week big short covering rally was likely to begin within a few days. Today looks like a good candidate. The Emini is up 5% in the Globex session. The CME has halted its trading. It is locked limit up. This makes higher prices likely today.
This will be a bear rally and not a repeat of January 2019. The selling will probably not end for a year. If there is now a secular bear market, the Emini will have a difficult time moving much above the February high for the next decade.
Overnight Emini Globex trading
I have been saying that the Emini would have a strong short covering rally that would begin within a few days. It probably began overnight. After selling to below yesterday’s low, it has rallied strongly. It has been locked limit up after a 5% gain above yesterday’s close. This increases the chance of a big bull trend day today. Furthermore, this is probably the start of a 1 – 2 week strong bear rally.
Yesterday’s setups

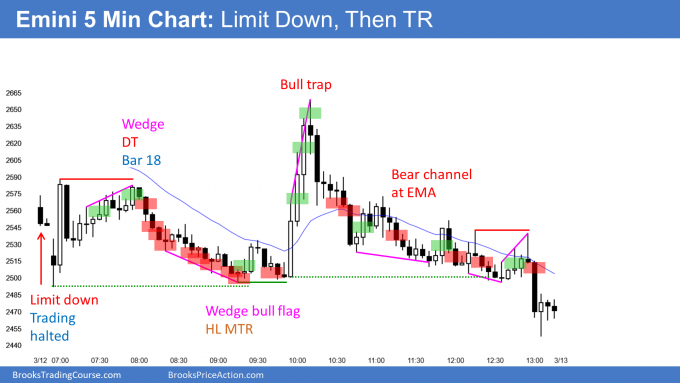
Here are several reasonable stop entry setups from yesterday. I show each buy entry with a green rectangle and each sell entry with a red rectangle. I rarely also show limit order entries and entries on the close of bars. Buyers of the Brooks Trading Course and Encyclopedia of Chart Patterns have access to a much more detailed explanation of the swing trades for each day.
My goal with these charts is to present an Always In perspective. If a trader was trying to be Always In or nearly Always In a position all day, and he was not currently in the market, these entries would be logical times for him to enter.
If the risk is too big for your account, you should wait for trades with less risk or trade an alternative market like the Micro Emini.
EURUSD Forex market trading strategies

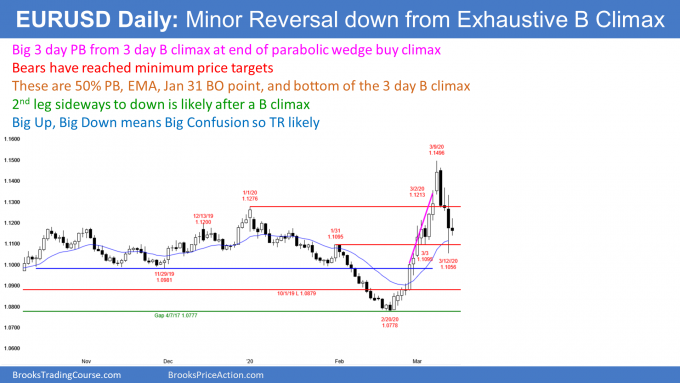
The daily chart of the EURUSD Forex market had its strongest rally in 2 years over the past few weeks. It was a parabolic wedge buy climax. The final 3 bull bars were an exhaustive buy climax. Traders expect at least 2 legs sideways to down to support.
The past 3 days will be the 1st leg down. The selling has reached all of the targets for the pullback. It tested the 3 day buy climax low, the EMA, the January 31 breakout point, and the 50% retracement level.
A big selloff after a big rally is a reversal. It creates confusion, which is a hallmark of a trading range. Consequently, traders should expect the EURUSD to be sideways to down for at least another week. Also, the bars will probably begin to get smaller.
The importance of the weekly close
Today is Friday so weekly support and resistance are important. The bulls want the week to close above the 18 month bear trend line. That is just a little above the current price.
However, the bears want this week’s breakout to fail. They would like this week to close on its low. It would then be a stronger sell signal bar on the weekly chart. They hope that the 3 week rally was just a bull trap in the 2 year bear trend. But, the rally was so exceptional. There will probably be at least a small 2nd leg up after the current pullback ends in a couple weeks.
Overnight EURUSD Forex trading
The 5 minute chart of the EURUSD Forex market has been in the middle of yesterday’s range overnight. So far, the EURUSD has been sideways in a small range. Yesterday’s was big. Today is an inside day. With yesterday having such a big range, today will probably remain an inside day.
The low of the week is 80 pips below the current price. Overnight, the EURUSD range would have to double for the week to close on its low. That is unlikely, given how small the legs up and down have been overnight.
The bulls want the week to close above the 18 month bear trend line. That is around 40 pips above the overnight high, which is only about half of the overnight range. Consequently, the bulls have a better chance of achieving their objective than the bears.
Day traders have been looking for reversals overnight and they have been scalping for 30 – 40 pips. That will probably continue all day.
Summary of today’s S&P Emini futures price action and what to expect tomorrow

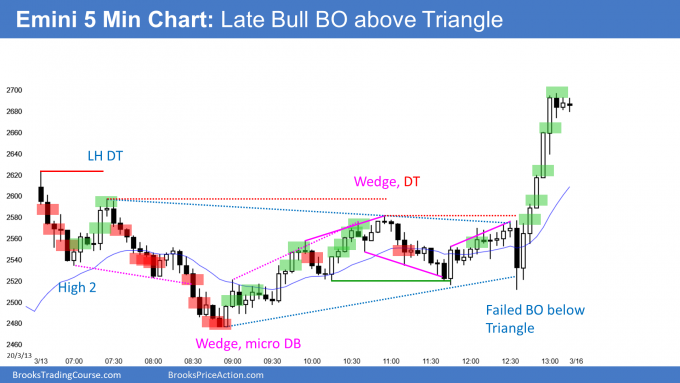
Here are several reasonable stop entry setups for today. I show each buy entry with a green rectangle and each sell entry with a red rectangle. I rarely also show limit order entries and entries on the close of bars. Buyers of the Brooks Trading Course and Encyclopedia of Chart Patterns have access to a much more detailed explanation of the swing trades for each day.
My goal with these charts is to present an Always In perspective. If a trader was trying to be Always In or nearly Always In a position all day, and he was not currently in the market, these entries would be logical times for him to enter.
If the risk is too big for your account, you should wait for trades with less risk or trade an alternative market like the Micro Emini.
End of day summary
The Emini was locked limit up at the end of the Globex session. When the day session opened, the Emini sold off for a couple hours. There was then a wedge bottom that led to a triangle. The bulls got a breakout at the end of the day.
Traders are wondering if the Emini is beginning a strong 1 – 2 week short covering rally. It should begin next week and it might have started yesterday. I mentioned early in the day that I bought calls, expecting a strong short covering rally. Everything should go up strongly for a couple weeks.
A gap up on Monday would create a 2 day island bottom. There is probably not much more downside risk near-term.
See the weekly update for a discussion of the price action on the weekly chart and for what to expect going into next week.
Trading Room
Traders can see the end of the day bar-by-bar price action report by signing up for free at BrooksPriceAction.com. I talk about the detailed S&P Emini futures price action real-time throughout the day in the BrooksPriceAction.com trading room. We offer a 2 day free trial.
Charts use Pacific Standard Time
When I mention time, it is USA Pacific Standard Time (the Emini day session opens at 6:30 am PST, and closes at 1:15 pm PST). You can read background information on the intraday market reports on the Market Update page.
The big bear trap at 12:30, do you think it was caused by the news?
I am trying to understand the psychology, because I think what Trump has said was probably bullish, but may be traders wanted to sell first to clear up room for buying?
Al: Quick question, which charting software do you use to monitor emini 5 min price action.
Thank You,
Al uses TradeStation. You can see more details in the My Setup article under the Learn to Trade menu or video #04 of trading course.