Emini and Forex Trading Update:
Thursday March 26, 2020
I will update again at the end of the day.
Pre-Open market analysis
The Emini yesterday formed a 2nd consecutive bull day. It was therefore confirmation that Tuesday’s breakout will probably be the start of a strong short covering rally.
However, the late selloff was a reminder that the rally will probably only lead to a trading range and not a bull trend. Yesterday is a sell signal bar in the month-long Small Pullback Bear Trend. But, there will probably be more buyers than sellers below its low.
The late selloff created a tail on the top of yesterday’s candlestick. The doji bar on the daily chart was disappointing for the bulls. Disappointment is a hallmark of a trading range.
It is consistent with what I have been saying. A strong short covering rally will only be a leg in a trading range on the daily chart. The top of the current leg up could be above 3,000 over the next 3 weeks. But, the bulls will probably not test the old high for at least a year or two.
Outside up week
Yesterday traded above last week’s high after falling below its low on Monday. This week is therefore an outside up week. It increases the chance of higher prices over the next few weeks. This will be especially true if this week closes above last week’s high and on the high of this week.
With only a few trading days left in March, the bulls would like the month to close back above the 12 year bull trend line. That is just above 2600 and certainly within reach.
Less likely, the bears will succeed in reversing the week back down to below last week’s low. This week would then be outside down. That would increase the chance of at least slightly lower prices next week.
Overnight Emini Globex trading
The Emini is unchanged in the Globex session. There is still a possible Small Pullback Bear Trend on the daily chart. Consequently, there is an increased chance that today will trigger the sell signal by going below yesterday’s low.
However, there have been consecutive closes on the daily chart above the bear trend line. Also, the Emini is at major support and the selloff already exceeded the average bear trend. Traders should expect buyers below yesterday’s low.
The odds are that the short covering rally is underway. That increases the chances of bull trend days over the next couple of weeks. Today will probably not be a big bear day.
If the short-term trend has in fact turned up, there will be signs of strength. One would be having this week close above last week’s high. Yesterday failed repeatedly to hold above that high. But as long as the Emini does not sell off strongly below yesterday’s low, the bulls will try to have the week close above last week’s high when the week ends tomorrow.
Yesterday’s setups

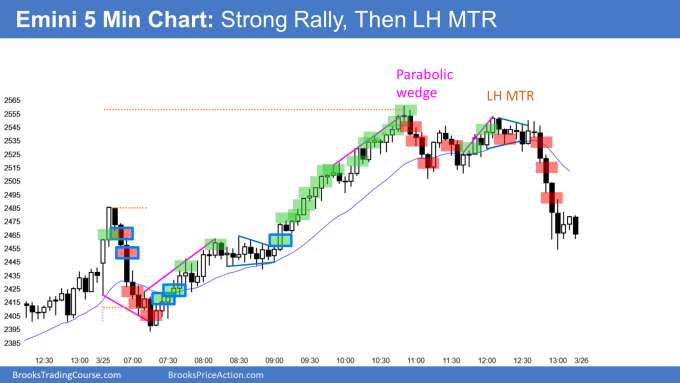
Here are several reasonable stop entry setups from yesterday. I show each buy entry with a green rectangle and each sell entry with a red rectangle. I rarely also show limit order entries and entries on the close of bars. Buyers of the Brooks Trading Course and Encyclopedia of Chart Patterns have access to a much more detailed explanation of the swing trades for each day (see Online Course/BTC Daily Setups).
My goal with these charts is to present an Always In perspective. If a trader was trying to be Always In or nearly Always In a position all day, and he was not currently in the market, these entries would be logical times for him to enter.
If the risk is too big for your account, you should wait for trades with less risk or trade an alternative market like the Micro Emini.
EURUSD Forex market trading strategies

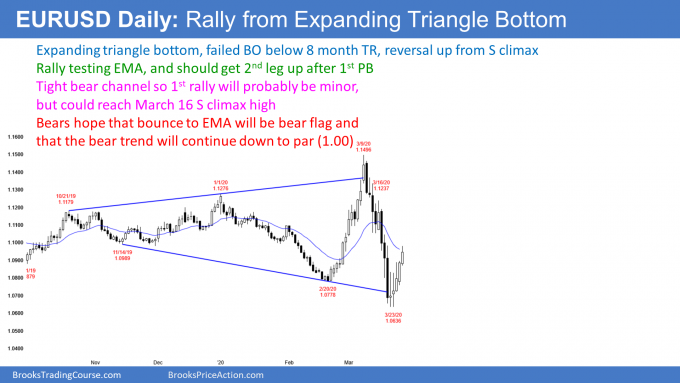
The daily chart of the EURUSD Forex market had a huge rally and a huge selloff in March. It has reversed up from an expanding triangle bottom this week.
While today is the 5th consecutive bull day, the rally will probably not go above the March high without at least one pullback lasting a few days. There is no sign of a top, but the EURUSD is entering a resistance zone. It is now at the 20 day EMA. A 50% retracement is a little higher. The bulls want the bull micro channel continues up to the March 16 sell climax high without a pullback, but that is unlikely.
The bears are hoping that the 5 day rally is just a bear flag. They had a very strong reversal down from a very strong rally in March. That typically results in at least a small 2nd leg sideways to down.
But after 5 days up, the bears will probably need at least a micro double top before they can get more than a 2 day pullback. Also, even if they drive the market down to the March low, there is still an 8 month trading range. Trading ranges resist breaking out. It is therefore more likely that a selloff would bounce around the March low. Traders should expect a small trading range for the next few weeks in the bottom half of the 8 month trading range.
Overnight EURUSD Forex trading
The 5 minute chart of the EURUSD Forex market rallied 100 pips overnight. The bars were not big and there was a lot of overlap, but the channel was tight. Day traders have been mostly looking to buy pullbacks. But, with the sharp pullback over the past hour, they will also look to sell rallies for scalps.
This selloff is big enough to make a big rally from here unlikely today. The rally has been strong enough to make a bear trend. Today will probably continue sideways to up.
Summary of today’s S&P Emini futures price action and what to expect tomorrow

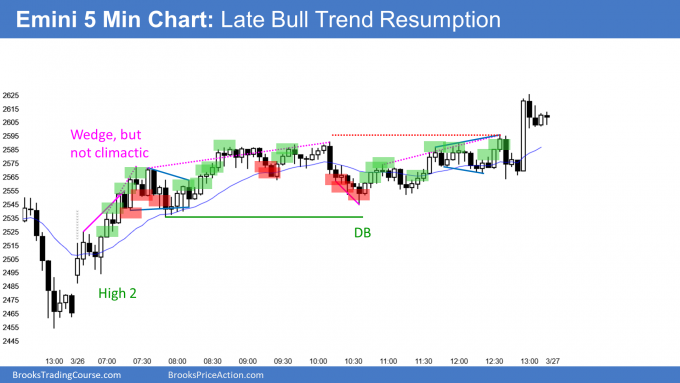
Here are several reasonable stop entry setups for today. I show each buy entry with a green rectangle and each sell entry with a red rectangle. I rarely also show limit order entries and entries on the close of bars. Buyers of the Brooks Trading Course and Encyclopedia of Chart Patterns have access to a much more detailed explanation of the swing trades for each day (see Online Course/BTC Daily Setups).
My goal with these charts is to present an Always In perspective. If a trader was trying to be Always In or nearly Always In a position all day, and he was not currently in the market, these entries would be logical times for him to enter.
If the risk is too big for your account, you should wait for trades with less risk or trade an alternative market like the Micro Emini.
End of day summary
The Emini rallied on the open to back above last week’s high. It then entered a trading range just above that high and just below the 2600 Big Round Number. It broke above 2600 minutes before the close.
Traders want to see if this week will close above last week’s high. If it does, it increases the chance of higher prices next week. If the week closes far below last week’s high, next week will probably be sideways.
It is currently more likely than not that the bear rally is underway. If so, the Emini will probably get above 3000 within a few months. However, the Emini is transitioning into a trading range from a bear trend. It will probably not test the February high for at least a couple years.
See the weekly update for a discussion of the price action on the weekly chart and for what to expect going into next week.
Trading Room
Traders can see the end of the day bar-by-bar price action report by signing up for free at BrooksPriceAction.com. I talk about the detailed S&P Emini futures price action real-time throughout the day in the BrooksPriceAction.com trading room. We offer a 2 day free trial.
Charts use Pacific Standard Time
When I mention time, it is USA Pacific Standard Time (the Emini day session opens at 6:30 am PST, and closes at 1:15 pm PST). You can read background information on the intraday market reports on the Market Update page.
Do you think we have THE bottom in yet? If the month finishes above the 20% pullback from ATH then it seems like we are in for a recovery and the bottom is in.
This is “a” bottom but probably not “the” bottom. I have not changed my opinion from what I have said many times. The Emini will be in a trading range this year, and probably for the next decade.
Al
I felt the break below 35 would be a major trend reversal with the close below the moving average what is the reason it wasn’t ? Not enough selling pressure an bad signal bar?
Only 40% of major trend reversal setups lead to a reversal of trend ( a major reversal means a bull trend into a bear trend). There was no good sell signal bar and that is a problem.
There are other factors at play here that made it even less likely. The bulls want the rally to go 20% above the low to claim this is a bull trend. They also want it to go above 2706, which is the 20% pullback, to erase the claim of the bear that it is still in a bear trend.
I have been talking about how strong the bear rally would be. Therefore most bear reversal attempts will fail.
I know you dont recommend the news as a source for trading tactics, but today is pretty special given the huge amount of jobless claims and still we are 5% up and pushing more. How would someone buy when there are 4mln Americans out of job in just 2 weeks time? Well, we follow the trend of course, but this spike today despite the economic outlook got me really puzzled!
I think there is an advantage to trading dumb. I ignore the news and just trade the chart. Most news is already priced in because traders are smarter than reporters. They anticipate what the news will be and then price is already where it needs to be once the reporter makes his scoop.
Based on Y late strong sell-off, I thought 9L was a good swing short for a DT LH MTR and PW on the open, specially having bulls bad SB 4. Could you comment this trade?